
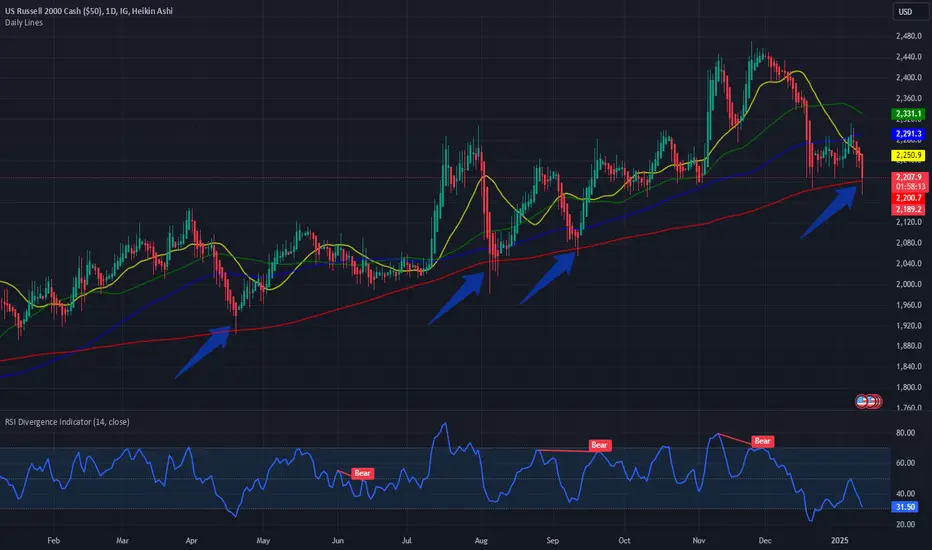
#TGIF. A simple chart to end the week. The US Small Cap index Russel 2000 its just hovering above its 200 Day SMA on the daily chart. Every time this happened in the last 1 year it was a bullish indicator in a medium term. The 50- and 100-Day SMA are below the 20 Day SMA which is a short term bearish indicator.

Clause de non-responsabilité
Les informations et publications ne sont pas destinées à être, et ne constituent pas, des conseils ou recommandations financiers, d'investissement, de trading ou autres fournis ou approuvés par TradingView. Pour en savoir plus, consultez les Conditions d'utilisation.
Clause de non-responsabilité
Les informations et publications ne sont pas destinées à être, et ne constituent pas, des conseils ou recommandations financiers, d'investissement, de trading ou autres fournis ou approuvés par TradingView. Pour en savoir plus, consultez les Conditions d'utilisation.