
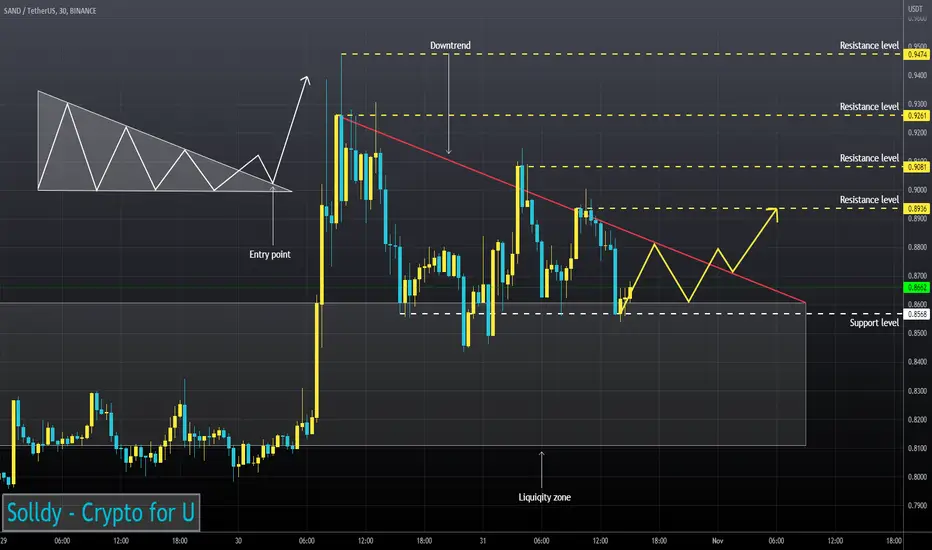
Trading volumes don't show sellers' interest in further price decrease.
SAND continues to move above the liquidity zone.
RSI continues to move in the Buy zone (4H TF) and at 30m Timeframe the RSI chart is testing the support level.
Price is testing 50EMA as support (1H TF)
I think the asset may bounce after it fixes above the downtrend line.
SAND continues to move above the liquidity zone.
RSI continues to move in the Buy zone (4H TF) and at 30m Timeframe the RSI chart is testing the support level.
Price is testing 50EMA as support (1H TF)
I think the asset may bounce after it fixes above the downtrend line.

Publications connexes
Clause de non-responsabilité
Les informations et publications ne sont pas destinées à être, et ne constituent pas, des conseils ou recommandations financiers, d'investissement, de trading ou autres fournis ou approuvés par TradingView. Pour en savoir plus, consultez les Conditions d'utilisation.
Publications connexes
Clause de non-responsabilité
Les informations et publications ne sont pas destinées à être, et ne constituent pas, des conseils ou recommandations financiers, d'investissement, de trading ou autres fournis ou approuvés par TradingView. Pour en savoir plus, consultez les Conditions d'utilisation.