
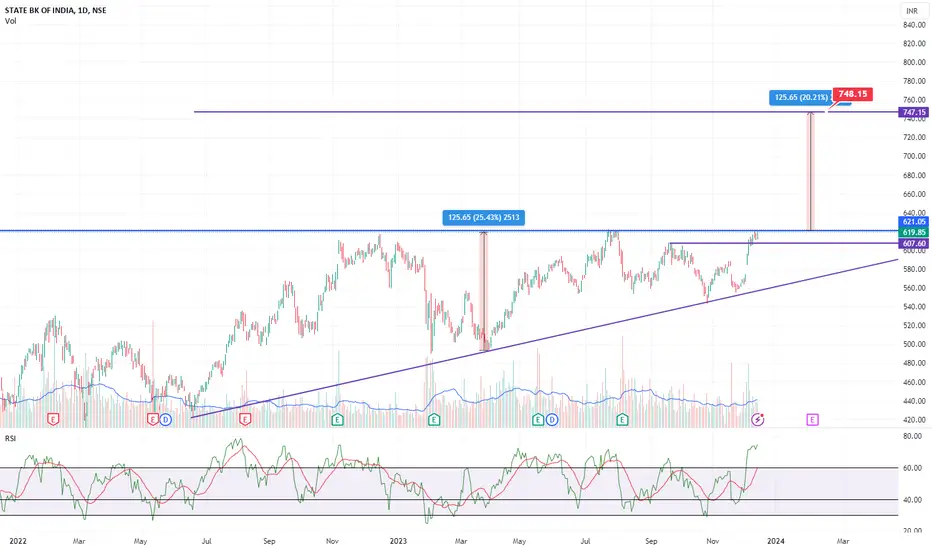
SBI form triangle pattern on weekly chart. If break and sustain above 620 weekly. It may test700-750 in next 2-3 months.
Transaction en cours
ActiveTransaction en cours
ActiveTransaction en cours
Now all loose hand out from stock and strong hands riding towards 740. It will go festered towards target now.So stay hold
Trade fermée: cible de profit atteinte
SBI target done 740+Enjoy the bumper profit.

Clause de non-responsabilité
Les informations et publications ne sont pas destinées à être, et ne constituent pas, des conseils ou recommandations financiers, d'investissement, de trading ou autres fournis ou approuvés par TradingView. Pour en savoir plus, consultez les Conditions d'utilisation.
Clause de non-responsabilité
Les informations et publications ne sont pas destinées à être, et ne constituent pas, des conseils ou recommandations financiers, d'investissement, de trading ou autres fournis ou approuvés par TradingView. Pour en savoir plus, consultez les Conditions d'utilisation.