
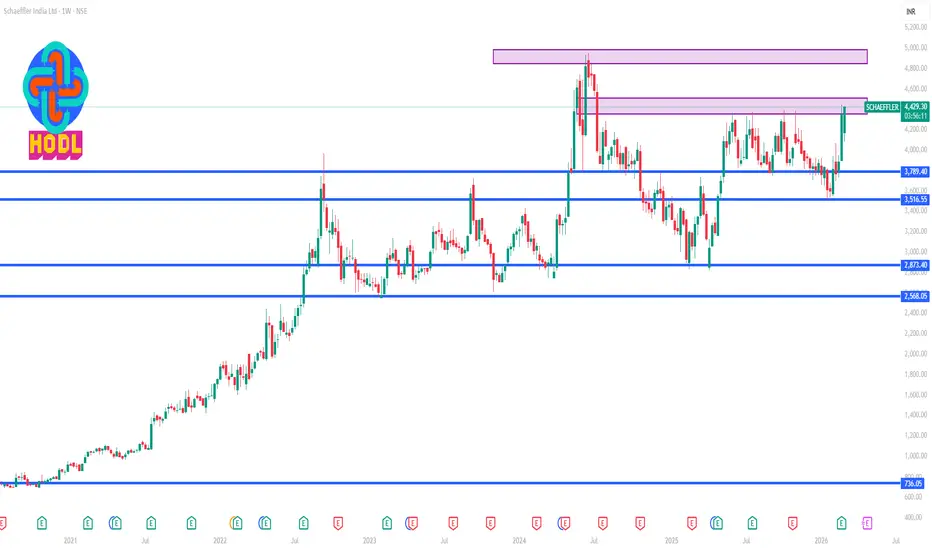
Current price: around ₹4,400– ₹4,420on NSE recently (March 2026 range).
📊 Weekly Time Frame Levels (Technical View)
🔹 Weekly Pivot
Pivot: ₹4,234
🔼 Weekly Resistance
R1: ₹4,566
R2: ₹4,776
R3: ₹5,108
🔽 Weekly Support
S1: ₹4,024
S2: ₹3,692
S3: ₹3,482
These pivot-based levels are calculated from previous week price action and used by traders to estimate possible breakout or reversal zones.
📈 Key Demand & Supply Zones (Weekly)
Strong Support Zone
₹4,000 – ₹4,020
₹3,690 – ₹3,720
Strong Resistance Zone
₹4,560 – ₹4,600
₹4,770 – ₹4,800
📉 Technical Indicators (Current)
RSI: ~55–60 → Neutral to bullish momentum
MACD: Buy signal
Moving averages: Mostly bullish alignment
This suggests the stock still has positive momentum on higher time frames.
🎯 Weekly Trading Scenarios
🟢 Bullish Scenario
If price sustains above ₹4,250–₹4,300
Target: ₹4,560 → ₹4,770
🟡 Sideways Scenario
Range likely:
₹4,000 – ₹4,500
🔴 Bearish Scenario
If ₹4,000 breaks
Next downside: ₹3,700 – ₹3,690
✅ Most important weekly levels
Breakout level: ₹4,300
Major resistance: ₹4,560
Major support: ₹4,000

Contact Knowledgehub for a detailed consultation: Dm on WhatsApp: [wa.link/a2o0kz]-
Phone No: [+91 93102 26243]-
Email: [tradingviewknowledgehub@gmail.com]---
-- Let’s achieve success together!
Phone No: [+91 93102 26243]-
Email: [tradingviewknowledgehub@gmail.com]---
-- Let’s achieve success together!
Publications connexes
Clause de non-responsabilité
Les informations et publications ne sont pas destinées à être, et ne constituent pas, des conseils ou recommandations financiers, d'investissement, de trading ou autres fournis ou approuvés par TradingView. Pour en savoir plus, consultez les Conditions d'utilisation.