
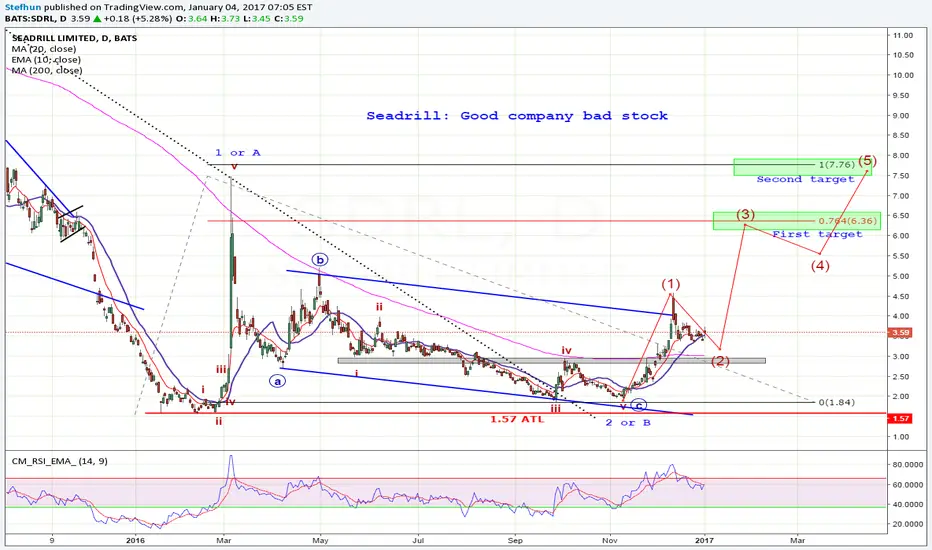
Stock went down from very high price to $1.57. Consolidation in progress.
This chart show that a good company can have a bad stock... I think this is a corrective movement after hit the $1.57 ATL
Flat to the upside... so, I do give a bigger probability to the ABC correction rather than impusle wave.
This is a daily chart but count based on weekly. Let's see how it will develop...

Clause de non-responsabilité
Les informations et publications ne sont pas destinées à être, et ne constituent pas, des conseils ou recommandations financiers, d'investissement, de trading ou autres fournis ou approuvés par TradingView. Pour en savoir plus, consultez les Conditions d'utilisation.
Clause de non-responsabilité
Les informations et publications ne sont pas destinées à être, et ne constituent pas, des conseils ou recommandations financiers, d'investissement, de trading ou autres fournis ou approuvés par TradingView. Pour en savoir plus, consultez les Conditions d'utilisation.