
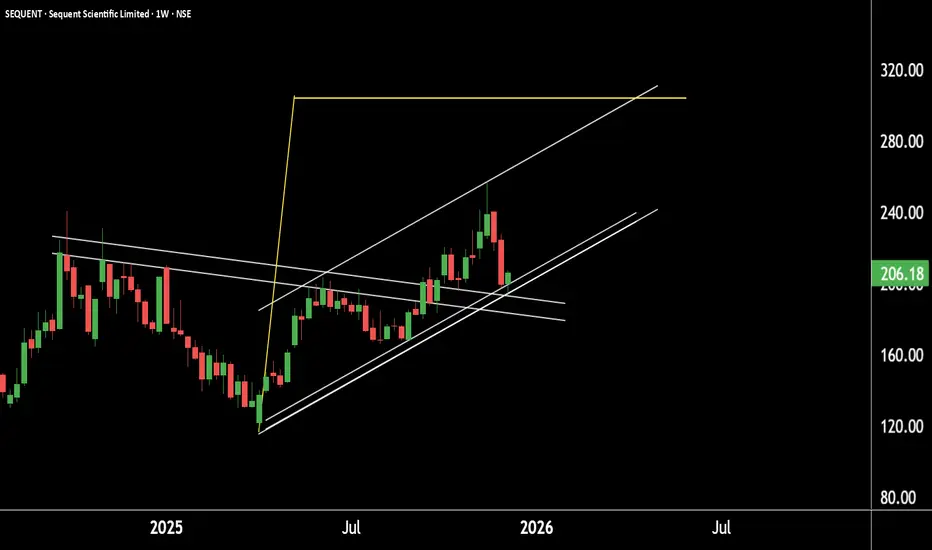
This is the weekly timeframe chart of Sequent Scientific.
The stock is currently trading near the key support zone of 180–190 and is moving within a well-defined structure.
If this support zone holds, we may see a potential upside move towards the 280 and 300 levels.
Thank you.
The stock is currently trading near the key support zone of 180–190 and is moving within a well-defined structure.
If this support zone holds, we may see a potential upside move towards the 280 and 300 levels.
Thank you.

@RahulSarawagi
Connect us at optionlab.co.in/
Connect us at optionlab.co.in/
Clause de non-responsabilité
Les informations et publications ne sont pas destinées à être, et ne constituent pas, des conseils ou recommandations financiers, d'investissement, de trading ou autres fournis ou approuvés par TradingView. Pour en savoir plus, consultez les Conditions d'utilisation.
@RahulSarawagi
Connect us at optionlab.co.in/
Connect us at optionlab.co.in/
Clause de non-responsabilité
Les informations et publications ne sont pas destinées à être, et ne constituent pas, des conseils ou recommandations financiers, d'investissement, de trading ou autres fournis ou approuvés par TradingView. Pour en savoir plus, consultez les Conditions d'utilisation.