
Shiba Inu (SHIB) technical analysis:
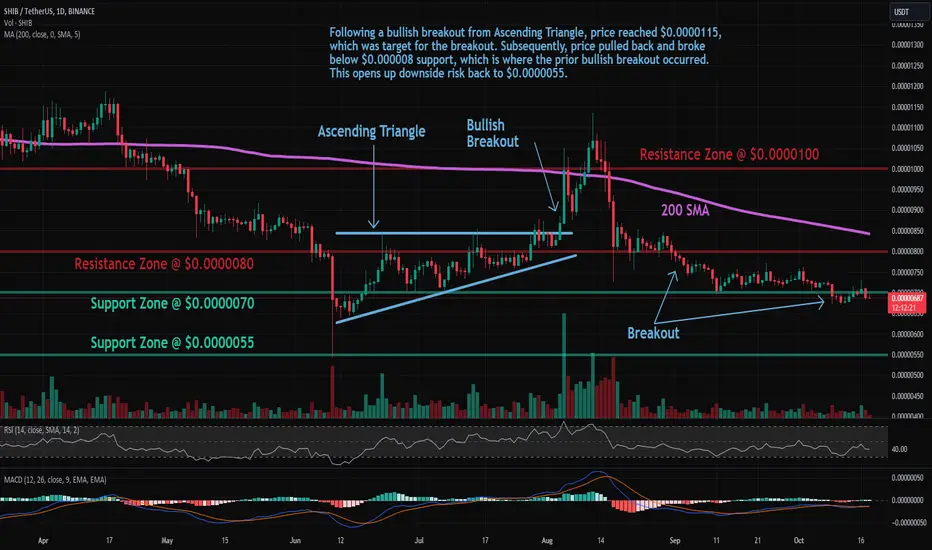
Trade setup: Following a bullish breakout from Ascending Triangle, price reached $0.0000115, which was target for the breakout. Subsequently, price pulled back and broke below $0.000008 support, which is where the prior bullish breakout occurred. This opens up downside risk back to $0.0000055.
Trend: Downtrend across all time horizons (Short- Medium- and Long-Term).
Momentum is Mixed as MACD Line is above MACD Signal Line (Bullish) but RSI < 45 (Bearish).
Support and Resistance: Nearest Support Zone is $0.0000070, which it broke, then $0.0000055. The nearest Resistance Zone is $0.0000080 (previous support), then $0.0000100, and $0.00001200.

Clause de non-responsabilité
Les informations et publications ne sont pas destinées à être, et ne constituent pas, des conseils ou recommandations financiers, d'investissement, de trading ou autres fournis ou approuvés par TradingView. Pour en savoir plus, consultez les Conditions d'utilisation.
Clause de non-responsabilité
Les informations et publications ne sont pas destinées à être, et ne constituent pas, des conseils ou recommandations financiers, d'investissement, de trading ou autres fournis ou approuvés par TradingView. Pour en savoir plus, consultez les Conditions d'utilisation.