
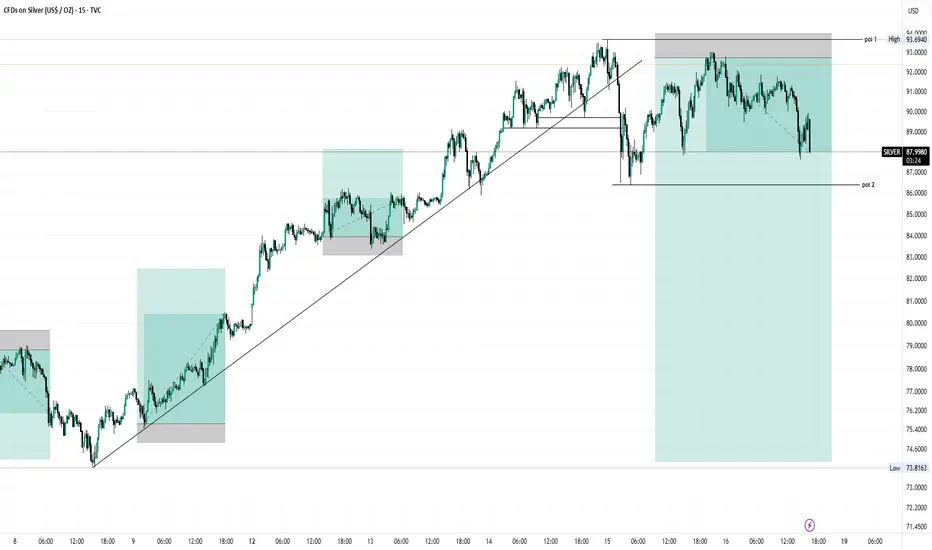
🧠 My Silver Analysis - Simple & Clear
Right now, this silver chart is showing me where price is likely to hesitate or move next by using a few key technical ideas:
📈 1. Where the Trend Is Headed
I’m watching the overall movement of price, whether it’s making higher highs and higher lows (uptrend) or lower highs and lower lows (downtrend). Trends help me decide if buyers or sellers are currently in control.
How to spot it:
If each peak is above the last and each low is above the previous low = bullish.
If peaks and lows keep dropping = bearish.
This structure is the backbone of my directional bias.
📊 2. Support & Resistance Zones
Instead of guessing, I draw zones (not exact numbers) where price has reacted repeatedly in the past, these are likely areas where traders have shown strong interest: buyers around support, sellers around resistance.
What this tells me:
Price may stall or bounce off these zones.
If price breaks through them with conviction, it often accelerates into the next zone.
Think of support as a floor buyers defend, and resistance as a ceiling sellers fight to keep price below.
📉 3. Trendlines & Price Structure
I connect significant swing lows and highs with smooth lines, these aren't perfect, but they help visualize pressure points where price tends to react.
A rising trendline below price supports bullish momentum.
A falling trendline above price highlights selling pressure.
If price breaks a key trendline and fails a retest, that’s often a signal things are changing, either shifting trend or entering a period of range movement.
🔁 4. Momentum and Confirmation
I don’t rely on just one factor, so if price hits a support zone and there’s a bullish pattern (like a strong bounce candle), I feel more confident in a buy idea.
The opposite is true for bearish moves.
I look for confirmation, not just hope:
Strong closed candles in the direction of my bias
Break + retest setups
Confluence of zones, trendlines, and patterns
This helps me avoid fake moves and get clearer on potential target and stop levels.
✍️ Putting It All Together
So in my own words, the chart is telling me something like:
“Price is approaching a key zone where buyers and sellers have historically shown interest. If it holds here, we could see a bounce back toward the recent highs. But if sellers overwhelm and price breaks the zone with conviction, the next level below becomes the target. I’ll be watching how price reacts at that level for clues about the next leg.”
🎯 Why This Helps Me
This kind of breakdown lets me:
✅ Trade with structure instead of guesswork
✅ Set clear levels for entries and exits
✅ Manage risk by knowing where my bias is invalidated
Right now, this silver chart is showing me where price is likely to hesitate or move next by using a few key technical ideas:
📈 1. Where the Trend Is Headed
I’m watching the overall movement of price, whether it’s making higher highs and higher lows (uptrend) or lower highs and lower lows (downtrend). Trends help me decide if buyers or sellers are currently in control.
How to spot it:
If each peak is above the last and each low is above the previous low = bullish.
If peaks and lows keep dropping = bearish.
This structure is the backbone of my directional bias.
📊 2. Support & Resistance Zones
Instead of guessing, I draw zones (not exact numbers) where price has reacted repeatedly in the past, these are likely areas where traders have shown strong interest: buyers around support, sellers around resistance.
What this tells me:
Price may stall or bounce off these zones.
If price breaks through them with conviction, it often accelerates into the next zone.
Think of support as a floor buyers defend, and resistance as a ceiling sellers fight to keep price below.
📉 3. Trendlines & Price Structure
I connect significant swing lows and highs with smooth lines, these aren't perfect, but they help visualize pressure points where price tends to react.
A rising trendline below price supports bullish momentum.
A falling trendline above price highlights selling pressure.
If price breaks a key trendline and fails a retest, that’s often a signal things are changing, either shifting trend or entering a period of range movement.
🔁 4. Momentum and Confirmation
I don’t rely on just one factor, so if price hits a support zone and there’s a bullish pattern (like a strong bounce candle), I feel more confident in a buy idea.
The opposite is true for bearish moves.
I look for confirmation, not just hope:
Strong closed candles in the direction of my bias
Break + retest setups
Confluence of zones, trendlines, and patterns
This helps me avoid fake moves and get clearer on potential target and stop levels.
✍️ Putting It All Together
So in my own words, the chart is telling me something like:
“Price is approaching a key zone where buyers and sellers have historically shown interest. If it holds here, we could see a bounce back toward the recent highs. But if sellers overwhelm and price breaks the zone with conviction, the next level below becomes the target. I’ll be watching how price reacts at that level for clues about the next leg.”
🎯 Why This Helps Me
This kind of breakdown lets me:
✅ Trade with structure instead of guesswork
✅ Set clear levels for entries and exits
✅ Manage risk by knowing where my bias is invalidated

Clause de non-responsabilité
Les informations et publications ne sont pas destinées à être, et ne constituent pas, des conseils ou recommandations financiers, d'investissement, de trading ou autres fournis ou approuvés par TradingView. Pour en savoir plus, consultez les Conditions d'utilisation.
Clause de non-responsabilité
Les informations et publications ne sont pas destinées à être, et ne constituent pas, des conseils ou recommandations financiers, d'investissement, de trading ou autres fournis ou approuvés par TradingView. Pour en savoir plus, consultez les Conditions d'utilisation.