
1. The Pole
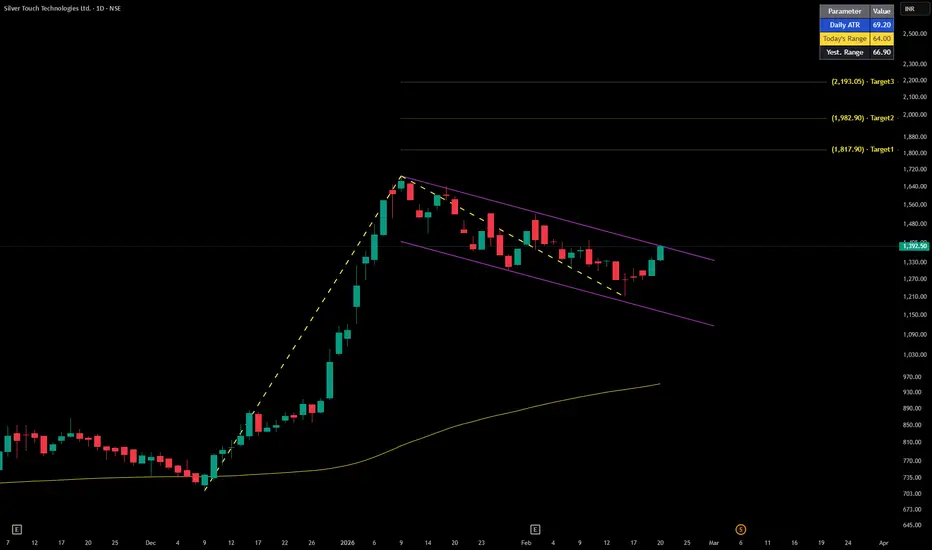
The sharp vertical rally forms the “pole.”
In your chart, this is the strong upward move that pushed price rapidly higher before consolidation began.
It reflects aggressive buying momentum and sets the stage for continuation.
2. The Flag
After the pole, price enters a downward sloping channel (two parallel purple lines in your chart).
This is the “flag” — a corrective phase where price consolidates against the prior trend.
Flags typically slope downward in bullish setups, showing profit‑taking but not a full reversal.
3. Technical Context
Current Price: ₹1,392.50
Daily ATR: 69.20 → volatility is moderate.
Today’s Range: 64.00 vs Yesterday’s 66.90 → consistent volatility.
Volume: 650K → healthy participation.
Moving Average (yellow line): price is consolidating near it, often a springboard for breakout.
Projection (green “1W” marker): suggests bullish breakout potential from the flag.
4. Bias & Strategy
Pattern Implication: Bullish continuation expected once price breaks above the flag’s upper boundary.
Entry Bias: Watch for breakout above ₹1,400–₹1,410 zone with volume confirmation.
Stop‑Loss Bias: Below flag support (~₹1,330).
✅ Verdict
Silver Touch Technologies is showing a Bullish Pole & Flag setup. The strong pole reflects momentum, and the flag consolidation is healthy. A breakout above the channel could trigger the next leg higher, with ATR and volume supporting the continuation bias.
The sharp vertical rally forms the “pole.”
In your chart, this is the strong upward move that pushed price rapidly higher before consolidation began.
It reflects aggressive buying momentum and sets the stage for continuation.
2. The Flag
After the pole, price enters a downward sloping channel (two parallel purple lines in your chart).
This is the “flag” — a corrective phase where price consolidates against the prior trend.
Flags typically slope downward in bullish setups, showing profit‑taking but not a full reversal.
3. Technical Context
Current Price: ₹1,392.50
Daily ATR: 69.20 → volatility is moderate.
Today’s Range: 64.00 vs Yesterday’s 66.90 → consistent volatility.
Volume: 650K → healthy participation.
Moving Average (yellow line): price is consolidating near it, often a springboard for breakout.
Projection (green “1W” marker): suggests bullish breakout potential from the flag.
4. Bias & Strategy
Pattern Implication: Bullish continuation expected once price breaks above the flag’s upper boundary.
Entry Bias: Watch for breakout above ₹1,400–₹1,410 zone with volume confirmation.
Stop‑Loss Bias: Below flag support (~₹1,330).
✅ Verdict
Silver Touch Technologies is showing a Bullish Pole & Flag setup. The strong pole reflects momentum, and the flag consolidation is healthy. A breakout above the channel could trigger the next leg higher, with ATR and volume supporting the continuation bias.

Sucrit.D.Patil
Clause de non-responsabilité
Les informations et publications ne sont pas destinées à être, et ne constituent pas, des conseils ou recommandations financiers, d'investissement, de trading ou autres fournis ou approuvés par TradingView. Pour en savoir plus, consultez les Conditions d'utilisation.
Sucrit.D.Patil
Clause de non-responsabilité
Les informations et publications ne sont pas destinées à être, et ne constituent pas, des conseils ou recommandations financiers, d'investissement, de trading ou autres fournis ou approuvés par TradingView. Pour en savoir plus, consultez les Conditions d'utilisation.