 SMH
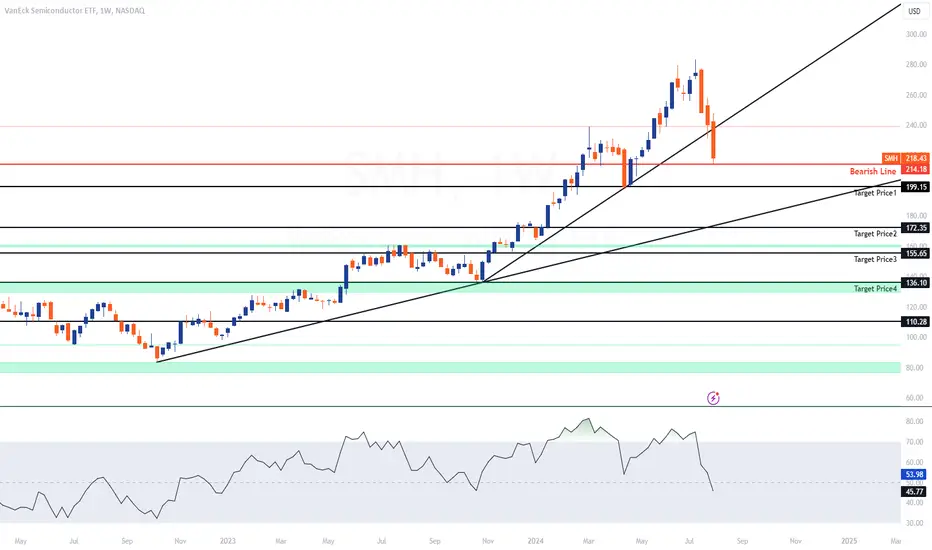
VanEck Semiconductor ETF (SMH) Weekly Analysis:
Current Price Action:
SMH is trading at $218.43, down 9.10% for the week.
Price has breached the upward trendline support, indicating potential further downside.
Key Levels:
Bearish Line: $214.18
Target Price 1: $199.15
Target Price 2: $172.35
Target Price 3: $155.65
Target Price 4: $136.10
Support Zones:
Immediate support is expected around $199.15.
Further support levels are $172.35, $155.65, and $136.10.
Resistance Levels:
Resistance is at the broken trendline near $240, followed by the recent high around $300.
Relative Strength Index (RSI):
RSI is at 53.98, trending downwards, suggesting weakening momentum.
Volume:
Volume is significant at 75.462M, indicating strong selling pressure.
Conclusion:
SMH's breakdown below key support levels and significant bearish momentum suggest further downside potential. Watch for reactions around $199.15 and $172.35 for potential entry points or further declines.
Trade fermée: cible de profit atteinte
Target Price 1: $199.15Note
TP2 HIT
Publications connexes
Clause de non-responsabilité
Les informations et publications ne sont pas destinées à être, et ne constituent pas, des conseils ou recommandations financiers, d'investissement, de trading ou autres fournis ou approuvés par TradingView. Pour en savoir plus, consultez les Conditions d'utilisation.