
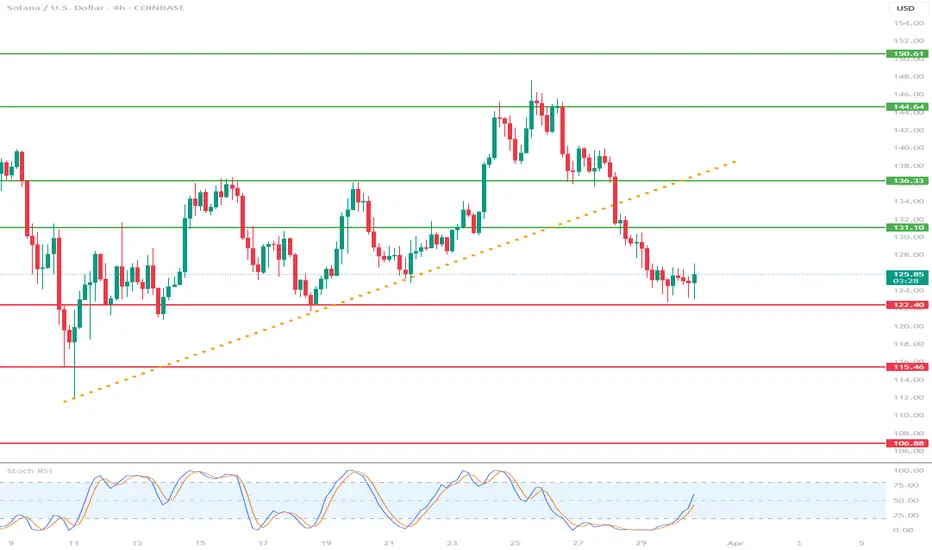
Hi everyone, let's look at the 4H SOL to USD chart, in this situation we can see how the price broke out from the local uptrend line at the bottom.
Let's start by defining the targets for the near future that the price has to face:
T1 = 131 USD
T2 = 136 USD
Т3 = 145 USD
Т4 = 151 USD
Now let's move on to the stop-loss in case the market continues to fall:
SL1 = 122 USD
SL2 = 115 USD
SL3 = 107 USD
If we look at the RSI indicator we can see how the indicator has dynamically gone up despite the price not moving much, but here we can see that there is still room for a potential attempt to grow.
Let's start by defining the targets for the near future that the price has to face:
T1 = 131 USD
T2 = 136 USD
Т3 = 145 USD
Т4 = 151 USD
Now let's move on to the stop-loss in case the market continues to fall:
SL1 = 122 USD
SL2 = 115 USD
SL3 = 107 USD
If we look at the RSI indicator we can see how the indicator has dynamically gone up despite the price not moving much, but here we can see that there is still room for a potential attempt to grow.

Clause de non-responsabilité
Les informations et publications ne sont pas destinées à être, et ne constituent pas, des conseils ou recommandations financiers, d'investissement, de trading ou autres fournis ou approuvés par TradingView. Pour en savoir plus, consultez les Conditions d'utilisation.
Clause de non-responsabilité
Les informations et publications ne sont pas destinées à être, et ne constituent pas, des conseils ou recommandations financiers, d'investissement, de trading ou autres fournis ou approuvés par TradingView. Pour en savoir plus, consultez les Conditions d'utilisation.