
Solana (SOL) technical analysis:
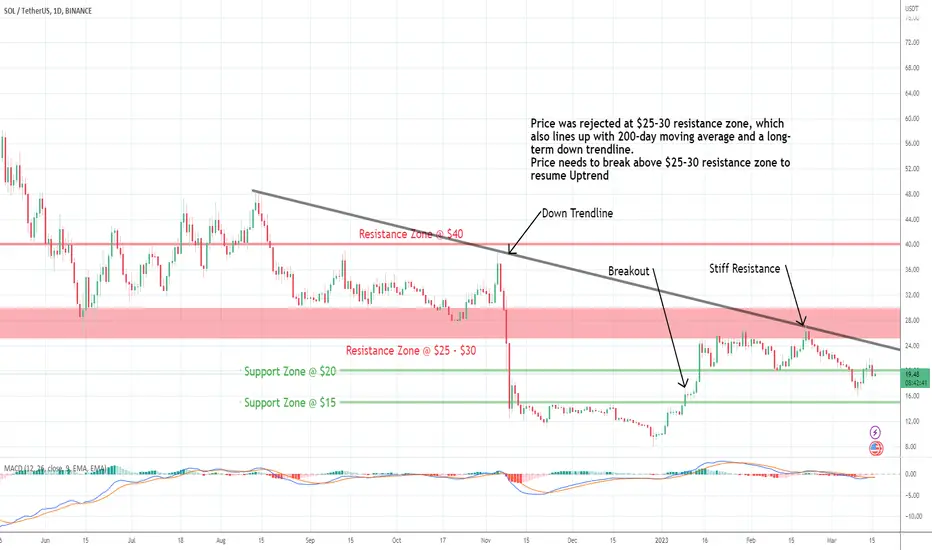
Trade setup: Price was rejected $25-30 resistance zone, which also lines up with 200-day moving average and a long-term down trendline. That makes that a very stiff resistance zone. Price needs to break above this stiff resistance area to indicate that buyers have soaked up all the supply overhang and to signal trend reversal.
Trend: Downtrend across all time horizons (Short- Medium- and Long-Term).
Momentum is Bearish but inflecting. MACD Line is below MACD Signal Line and RSI is below 45 but momentum may have bottomed since MACD Histogram bars are rising, which suggests that momentum could be nearing another upswing.
Support and Resistance Nearest Support Zone is $20, then $15. The nearest Resistance Zone is $25 – $30, then $40.
Trade setup: Price was rejected $25-30 resistance zone, which also lines up with 200-day moving average and a long-term down trendline. That makes that a very stiff resistance zone. Price needs to break above this stiff resistance area to indicate that buyers have soaked up all the supply overhang and to signal trend reversal.
Trend: Downtrend across all time horizons (Short- Medium- and Long-Term).
Momentum is Bearish but inflecting. MACD Line is below MACD Signal Line and RSI is below 45 but momentum may have bottomed since MACD Histogram bars are rising, which suggests that momentum could be nearing another upswing.
Support and Resistance Nearest Support Zone is $20, then $15. The nearest Resistance Zone is $25 – $30, then $40.

Clause de non-responsabilité
Les informations et publications ne sont pas destinées à être, et ne constituent pas, des conseils ou recommandations financiers, d'investissement, de trading ou autres fournis ou approuvés par TradingView. Pour en savoir plus, consultez les Conditions d'utilisation.
Clause de non-responsabilité
Les informations et publications ne sont pas destinées à être, et ne constituent pas, des conseils ou recommandations financiers, d'investissement, de trading ou autres fournis ou approuvés par TradingView. Pour en savoir plus, consultez les Conditions d'utilisation.