
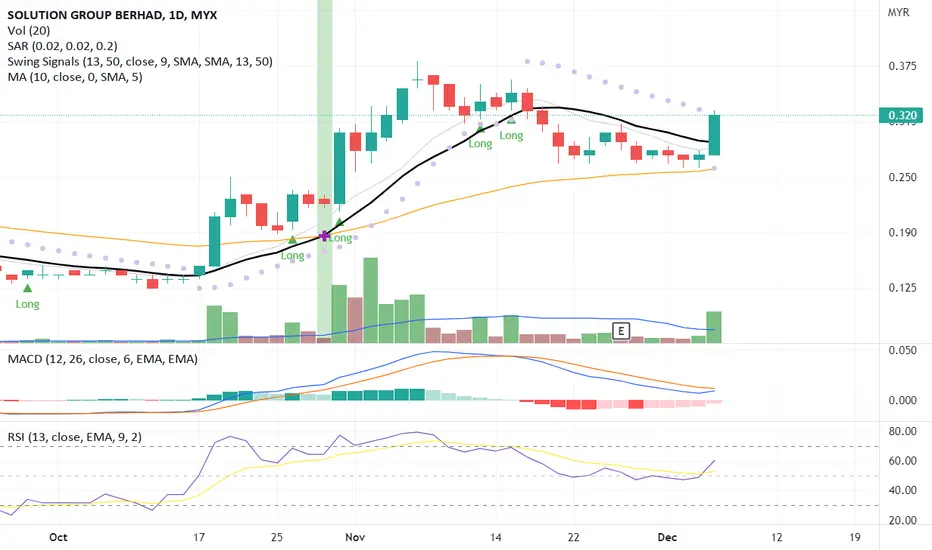
The candlestick pattern indicates a price breakout signal right above the MA13 line due to significant price movement backed by high volume.
The MACD and RSI also show a positive reading which indicates a divergence signal.
Let's SOLUTN in WL and watch out for significant price movement toward the next price resistance.
R 0.380
S 0.270
The MACD and RSI also show a positive reading which indicates a divergence signal.
Let's SOLUTN in WL and watch out for significant price movement toward the next price resistance.
R 0.380
S 0.270

Clause de non-responsabilité
Les informations et publications ne sont pas destinées à être, et ne constituent pas, des conseils ou recommandations financiers, d'investissement, de trading ou autres fournis ou approuvés par TradingView. Pour en savoir plus, consultez les Conditions d'utilisation.
Clause de non-responsabilité
Les informations et publications ne sont pas destinées à être, et ne constituent pas, des conseils ou recommandations financiers, d'investissement, de trading ou autres fournis ou approuvés par TradingView. Pour en savoir plus, consultez les Conditions d'utilisation.