
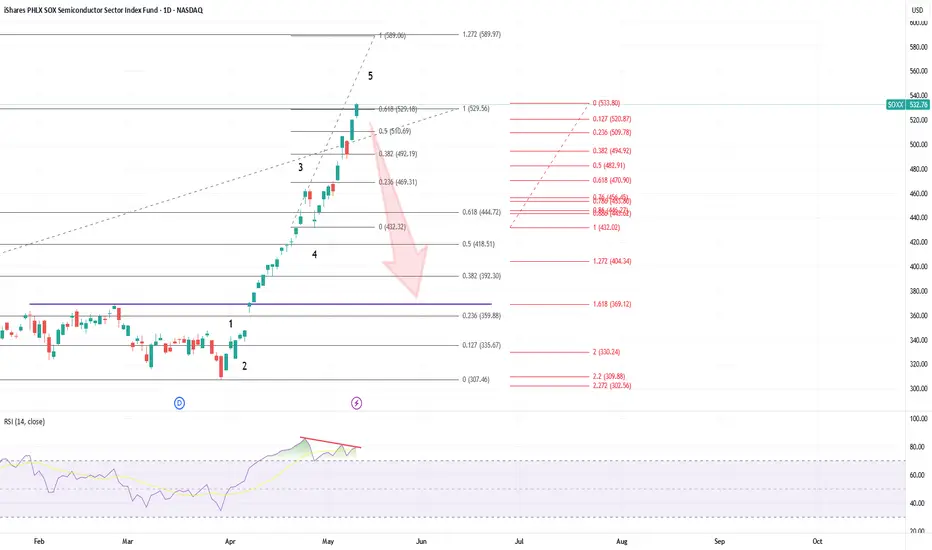
The price has reached 529 level which is a potential top based on fib relations.
Double daily RSI divergence indicates that the price is ready to go down.
1.618 fib of wave 4 bottom to wave 5 top brings us exactly to previous major peak at 369 level - the price should return there sooner or later.
Double daily RSI divergence indicates that the price is ready to go down.
1.618 fib of wave 4 bottom to wave 5 top brings us exactly to previous major peak at 369 level - the price should return there sooner or later.
Trade fermée: ordre d’arrêt atteint
New higher high invalidates my wave count. But we just got a small divergence and a hanging man candle on a weekly timeframe. Not sure about the wave structure. Need to wait for more reversal signals on smaller timeframes.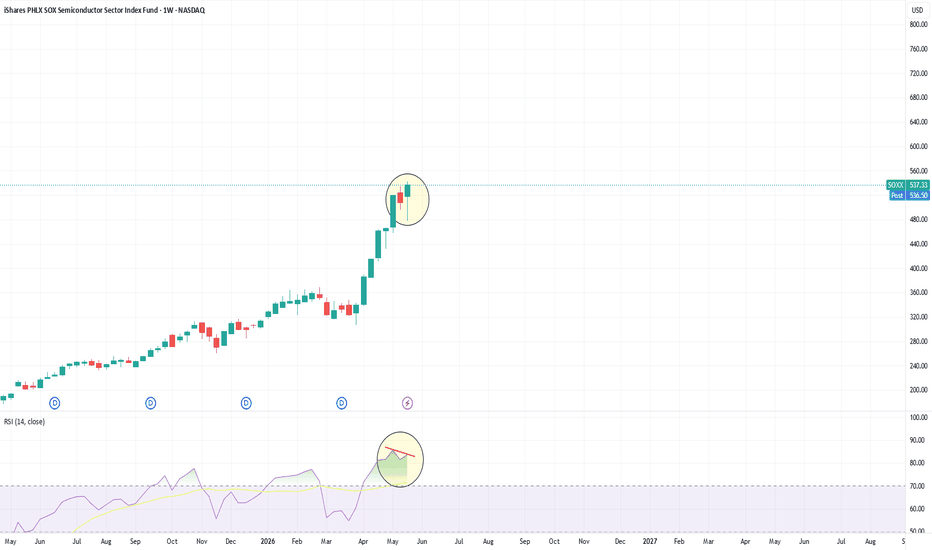
Note
The price reached 571 level which is 1.618 fib of new wave 3 top to wave 4 bottom. This is a possible top, but be careful. This could be wave 3 of 5 top. I still think it can reach 590 area.Note
To be honest, now I think this is the top. I'm shorting it into the weekly close.Note
It can still be a trap. It didn't reach 590 level and there is no 2h divergence on RSI indicator.Note
The same goes for Nasdaq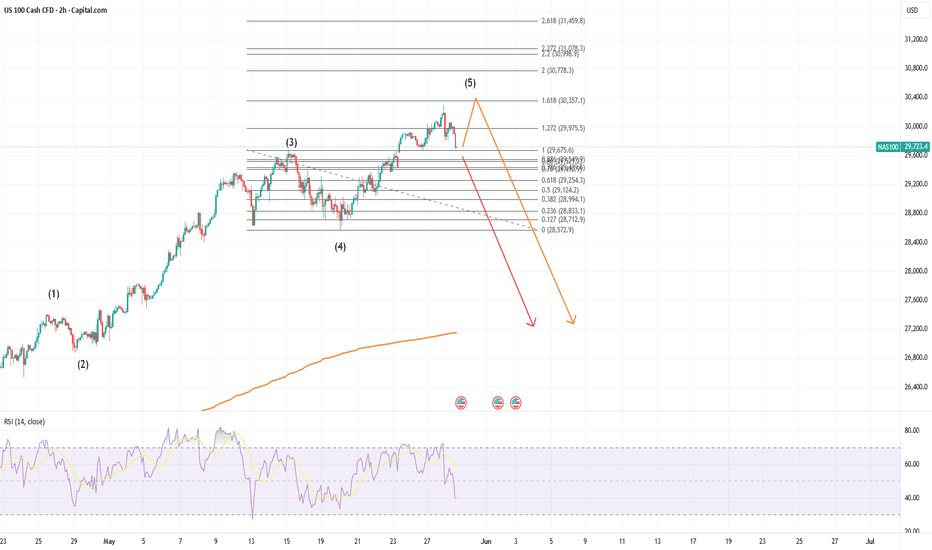

Clause de non-responsabilité
Les informations et publications ne sont pas destinées à être, et ne constituent pas, des conseils ou recommandations financiers, d'investissement, de trading ou autres fournis ou approuvés par TradingView. Pour en savoir plus, consultez les Conditions d'utilisation.
Clause de non-responsabilité
Les informations et publications ne sont pas destinées à être, et ne constituent pas, des conseils ou recommandations financiers, d'investissement, de trading ou autres fournis ou approuvés par TradingView. Pour en savoir plus, consultez les Conditions d'utilisation.