
🚀 The biggest IPO ever, then the hangover
SpaceX went public this June in the largest IPO in history, priced near 135 dollars a share at a valuation close to 1.8 trillion. Then came the hangover. The hype cooled, early buyers cashed out, and the price slid hard over the following weeks down into the low 100s. The contract on this chart, SPCX on Binance, is a perpetual that tracks SpaceX's share price and settles in stablecoin, so you never hold actual equity in the company. What it does give you is a clean view of a textbook pattern.
🛰️ Why buyers came back down low
The selloff did not happen in a vacuum, and neither did the bounce. SpaceX posted its first earnings as a public company in early August, and the business underneath the stock is strong.
Reports put Starlink, its satellite internet arm, near 12 million subscribers, roughly double a year earlier and the bulk of company revenue. The IPO left it holding a cash pile reported around 93 billion dollars. And it signed a deal to supply computing capacity to Google worth a reported 920 million a month. Those are the kind of hard numbers that give large buyers a reason to step in while the price is marked down.
📚 What accumulation looks like
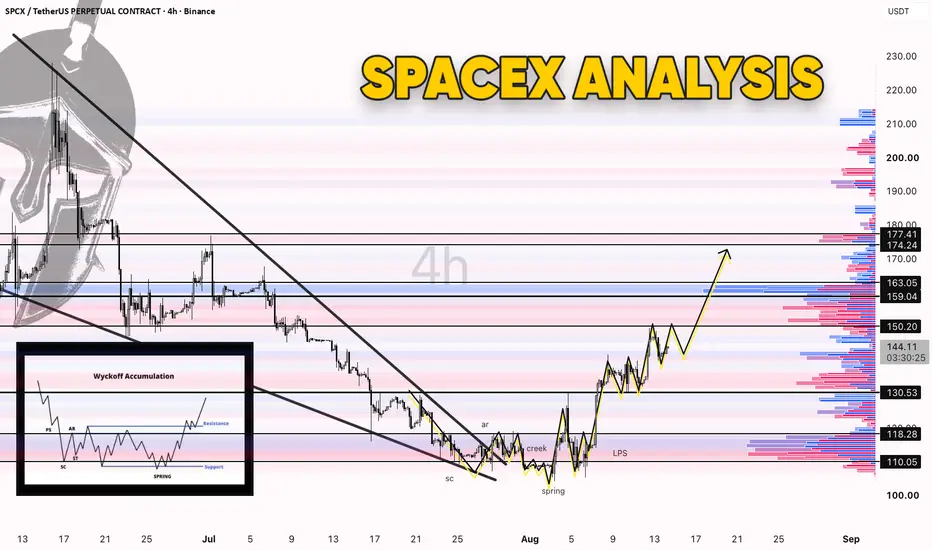
This is a Wyckoff accumulation, a pattern named after the trader who mapped it, where big money quietly builds a position after a crash before the next leg up. It runs in a set sequence, and this chart hit every beat.
First the selling climax near 110, the panic low where heavy selling finally got soaked up. Then a bounce, then the spring, a last stab under support that shakes out the last nervous sellers and traps whoever is shorting the lows. Then a higher low, the last point of support around 118, which becomes the launchpad. Price is now above that range and marking up, which just means trending higher out of the base.
The fundamentals tell you why patient money would accumulate SpaceX down here. Wyckoff shows you the footprints they left doing it.
📊 The levels that matter now
Price is near 143 and climbing. Overhead, the first ceiling is 150, then the heavier band at 159 to 163 where old sellers and a shelf of prior volume sit stacked together, then the highs at 174 to 177 the projection is aimed at. Underneath, the markup stays healthy while 130 holds. Below that sits the 118 to 120 support, and then 110, the spring low.
⚖️ Two ways from here
The structure favors the upside: hold above 130 and grind the markup through 150 into the 159 to 163 band, where I would expect the first real fight, with 174 to 177 as the stretch target. The other side is simple. Lose 130 and price slips back into the range, and a close under 110 says that base was a trap, not accumulation. Between 130 and 150 it is still just doing the work.
SpaceX went public this June in the largest IPO in history, priced near 135 dollars a share at a valuation close to 1.8 trillion. Then came the hangover. The hype cooled, early buyers cashed out, and the price slid hard over the following weeks down into the low 100s. The contract on this chart, SPCX on Binance, is a perpetual that tracks SpaceX's share price and settles in stablecoin, so you never hold actual equity in the company. What it does give you is a clean view of a textbook pattern.
🛰️ Why buyers came back down low
The selloff did not happen in a vacuum, and neither did the bounce. SpaceX posted its first earnings as a public company in early August, and the business underneath the stock is strong.
Reports put Starlink, its satellite internet arm, near 12 million subscribers, roughly double a year earlier and the bulk of company revenue. The IPO left it holding a cash pile reported around 93 billion dollars. And it signed a deal to supply computing capacity to Google worth a reported 920 million a month. Those are the kind of hard numbers that give large buyers a reason to step in while the price is marked down.
📚 What accumulation looks like
This is a Wyckoff accumulation, a pattern named after the trader who mapped it, where big money quietly builds a position after a crash before the next leg up. It runs in a set sequence, and this chart hit every beat.
First the selling climax near 110, the panic low where heavy selling finally got soaked up. Then a bounce, then the spring, a last stab under support that shakes out the last nervous sellers and traps whoever is shorting the lows. Then a higher low, the last point of support around 118, which becomes the launchpad. Price is now above that range and marking up, which just means trending higher out of the base.
The fundamentals tell you why patient money would accumulate SpaceX down here. Wyckoff shows you the footprints they left doing it.
📊 The levels that matter now
Price is near 143 and climbing. Overhead, the first ceiling is 150, then the heavier band at 159 to 163 where old sellers and a shelf of prior volume sit stacked together, then the highs at 174 to 177 the projection is aimed at. Underneath, the markup stays healthy while 130 holds. Below that sits the 118 to 120 support, and then 110, the spring low.
⚖️ Two ways from here
The structure favors the upside: hold above 130 and grind the markup through 150 into the 159 to 163 band, where I would expect the first real fight, with 174 to 177 as the stretch target. The other side is simple. Lose 130 and price slips back into the range, and a close under 110 says that base was a trap, not accumulation. Between 130 and 150 it is still just doing the work.
Fresh off the biggest IPO ever and printing a classic accumulation. Where does this one run out of room, the 159 to 163 band or the old highs?

SkillTrade · skill-based trading contests, launching soon.
Same start. Same market. Sharpest trader wins.
👉 New lessons every Monday and Thursday.
TG: t.me/+7cYXQ5wuoodmZmMy
Same start. Same market. Sharpest trader wins.
👉 New lessons every Monday and Thursday.
TG: t.me/+7cYXQ5wuoodmZmMy
Clause de non-responsabilité
Les informations et publications ne sont pas destinées à être, et ne constituent pas, des conseils ou recommandations financiers, d'investissement, de trading ou autres fournis ou approuvés par TradingView. Pour en savoir plus, consultez les Conditions d'utilisation.
SkillTrade · skill-based trading contests, launching soon.
Same start. Same market. Sharpest trader wins.
👉 New lessons every Monday and Thursday.
TG: t.me/+7cYXQ5wuoodmZmMy
Same start. Same market. Sharpest trader wins.
👉 New lessons every Monday and Thursday.
TG: t.me/+7cYXQ5wuoodmZmMy
Clause de non-responsabilité
Les informations et publications ne sont pas destinées à être, et ne constituent pas, des conseils ou recommandations financiers, d'investissement, de trading ou autres fournis ou approuvés par TradingView. Pour en savoir plus, consultez les Conditions d'utilisation.