S&P 500 Index ( SPX) Daily: Bullish Wedge Rebound off 72-SMA Ribbon Targets 7,647 Expansion Ceiling
### 🇺🇸 USA S&P 500 Index (SPX) Daily Technical Matrix (Ref: SPX_2026-07-29_08-43-59.png)
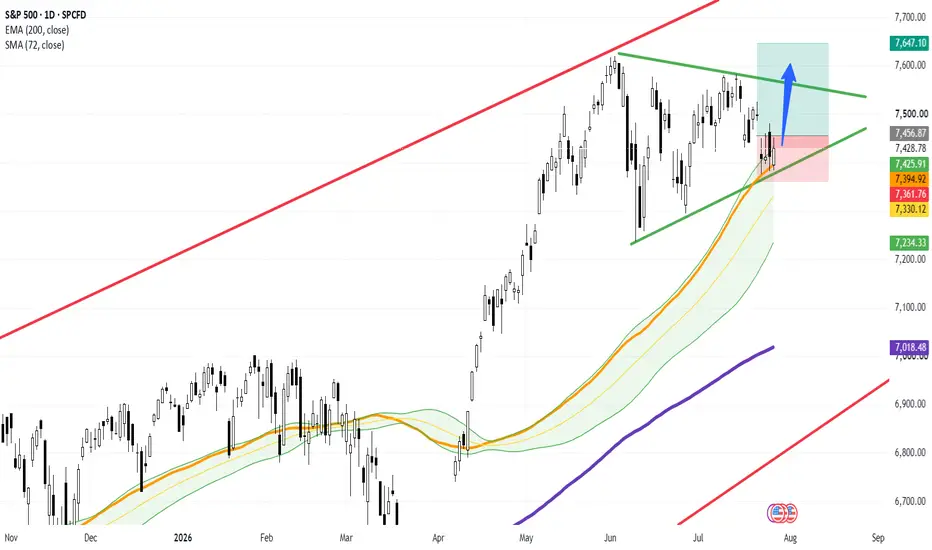
We are releasing a daily (1D) structural framework on the S&P 500 Index (SPX). Following a healthy consolidation cycle within a contracting wedge structure, price action has successfully retested a high-confluence demand zone, springing off dynamic moving average support to initiate a fresh bullish momentum wave.
The index is trading higher today at **7,428.78 (+0.21%)**, demonstrating solid buy-side absorption above key moving average boundaries.
---
### 🔍 Technical Architecture & Dynamic Confluence Node:
Our quantitative framework highlights a textbook continuation pattern on the daily time horizon:
1. **The Contracting Wedge Geometry:** Price action is tightly contained within an ascending wedge consolidation, bounded by a upper descending resistance trendline (green LTB) and an ascending support trendline (green LTA floor).
2. **Dynamic 72-SMA Ribbon Cushion:** The immediate bounce aligns directly with the **72-period SMA ribbon cluster (tracked between 7,330.12 and 7,425.91)**. The strong lower candle wicks validate institutional defense along this dynamic band.
3. **Macro Trend Foundation:** Long-term market health remains firmly intact, supported well above the ascending **200-period EMA (purple line sitting at 7,018.48)**.
---
### 🎯 Tactical Long Execution Framework (Blue Vector Impulse):
The risk-to-reward architecture is highly asymmetric, targeting a breakout of the upper wedge boundary:
* **Tactical Accumulation Corridor:** **7,425.91 – 7,456.87** zone.
* **Protective Stop Loss Anchor:** Positioned below the wedge support floor and 72-SMA ribbon at **7,361.76**.
* **Breakout Trigger Level:** A daily closing candle above the descending resistance trendline near **7,550.00** confirms the wedge breakout.
* **Primary Take Profit Target:** Extended impulse projection aims for the major structural supply ceiling at **7,647.10**.
### 📊 Tactical Parameters Summary:
* **Current Bias:** Bullish Rebound / Wedge Continuation
* **Dynamic Demand Support (72-SMA):** 7,425.91
* **Risk Invalidation Floor (Stop Loss):** 7,361.76
* **Wedge Breakout Resistance:** ~7,550.00
* **Primary Upside Target:** 7,647.10
---
📊 **ChartPro Data**
*US Equity Architecture, Continuation Geometry & Systematic Risk Management.*
⚠️ **Disclaimer:** For educational and informational purposes only. This active market study represents a personal trading framework and does not constitute financial or investment advice.
SPX) Daily: Bullish Wedge Rebound off 72-SMA Ribbon Targets 7,647 Expansion Ceiling### 🇺🇸 USA S&P 500 Index (
SPX) Daily Technical Matrix (Ref: SPX_2026-07-29_08-43-59.png)We are releasing a daily (1D) structural framework on the S&P 500 Index (
SPX). Following a healthy consolidation cycle within a contracting wedge structure, price action has successfully retested a high-confluence demand zone, springing off dynamic moving average support to initiate a fresh bullish momentum wave.The index is trading higher today at **7,428.78 (+0.21%)**, demonstrating solid buy-side absorption above key moving average boundaries.
---
### 🔍 Technical Architecture & Dynamic Confluence Node:
Our quantitative framework highlights a textbook continuation pattern on the daily time horizon:
1. **The Contracting Wedge Geometry:** Price action is tightly contained within an ascending wedge consolidation, bounded by a upper descending resistance trendline (green LTB) and an ascending support trendline (green LTA floor).
2. **Dynamic 72-SMA Ribbon Cushion:** The immediate bounce aligns directly with the **72-period SMA ribbon cluster (tracked between 7,330.12 and 7,425.91)**. The strong lower candle wicks validate institutional defense along this dynamic band.
3. **Macro Trend Foundation:** Long-term market health remains firmly intact, supported well above the ascending **200-period EMA (purple line sitting at 7,018.48)**.
---
### 🎯 Tactical Long Execution Framework (Blue Vector Impulse):
The risk-to-reward architecture is highly asymmetric, targeting a breakout of the upper wedge boundary:
* **Tactical Accumulation Corridor:** **7,425.91 – 7,456.87** zone.
* **Protective Stop Loss Anchor:** Positioned below the wedge support floor and 72-SMA ribbon at **7,361.76**.
* **Breakout Trigger Level:** A daily closing candle above the descending resistance trendline near **7,550.00** confirms the wedge breakout.
* **Primary Take Profit Target:** Extended impulse projection aims for the major structural supply ceiling at **7,647.10**.
### 📊 Tactical Parameters Summary:
* **Current Bias:** Bullish Rebound / Wedge Continuation
* **Dynamic Demand Support (72-SMA):** 7,425.91
* **Risk Invalidation Floor (Stop Loss):** 7,361.76
* **Wedge Breakout Resistance:** ~7,550.00
* **Primary Upside Target:** 7,647.10
---
📊 **ChartPro Data**
*US Equity Architecture, Continuation Geometry & Systematic Risk Management.*
⚠️ **Disclaimer:** For educational and informational purposes only. This active market study represents a personal trading framework and does not constitute financial or investment advice.

Clause de non-responsabilité
Les informations et publications ne sont pas destinées à être, et ne constituent pas, des conseils ou recommandations financiers, d'investissement, de trading ou autres fournis ou approuvés par TradingView. Pour en savoir plus, consultez les Conditions d'utilisation.
Clause de non-responsabilité
Les informations et publications ne sont pas destinées à être, et ne constituent pas, des conseils ou recommandations financiers, d'investissement, de trading ou autres fournis ou approuvés par TradingView. Pour en savoir plus, consultez les Conditions d'utilisation.