
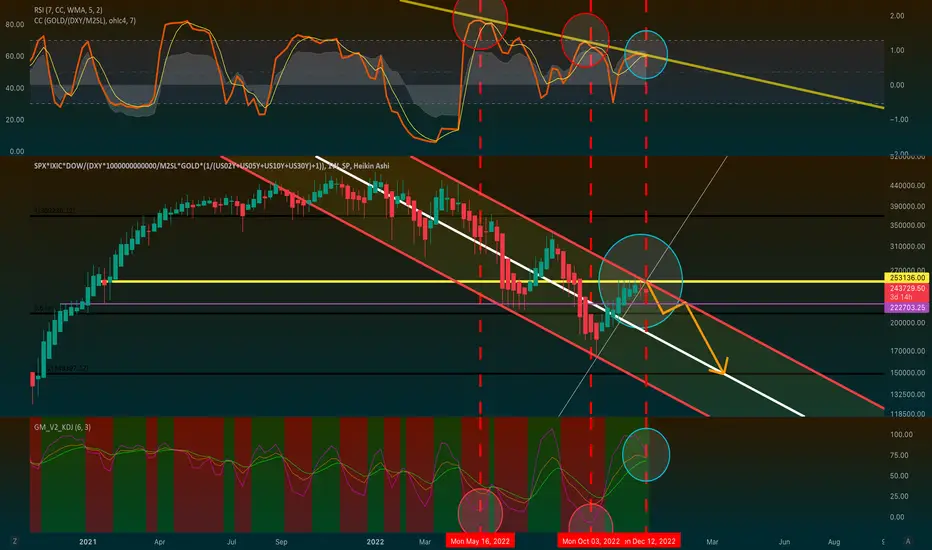
The assumption of an inverse relationship between the gold and stocks implies a negative correlation coefficient. KDJ (bottom) and CC (top) had inverse peaks and troughs in those circled periods. This time (blue circle) the two indicators aligned to fall. KDJ predicting the downfall of stocks may confirm the market equilibrium resetting. Moreover, the graph presented (explained below) displays a bounce from the significant red resistance.
Graph:
(SPX*IXIC*DOW)/(TVC:DXY*1000000000000/M2SL*TVC:GOLD*(1/(TVC:US02Y+TVC:US05Y+TVC:US10Y+TVC:US30Y)+1))
= (SPX * IXIC * DOW) / (DXY/USM2 * GOLD * U.S BONDS)
= (American Indices) / (Recession-proof Assets)
Graph:
(SPX*IXIC*DOW)/(TVC:DXY*1000000000000/M2SL*TVC:GOLD*(1/(TVC:US02Y+TVC:US05Y+TVC:US10Y+TVC:US30Y)+1))
= (SPX * IXIC * DOW) / (DXY/USM2 * GOLD * U.S BONDS)
= (American Indices) / (Recession-proof Assets)

Clause de non-responsabilité
Les informations et publications ne sont pas destinées à être, et ne constituent pas, des conseils ou recommandations financiers, d'investissement, de trading ou autres fournis ou approuvés par TradingView. Pour en savoir plus, consultez les Conditions d'utilisation.
Clause de non-responsabilité
Les informations et publications ne sont pas destinées à être, et ne constituent pas, des conseils ou recommandations financiers, d'investissement, de trading ou autres fournis ou approuvés par TradingView. Pour en savoir plus, consultez les Conditions d'utilisation.