
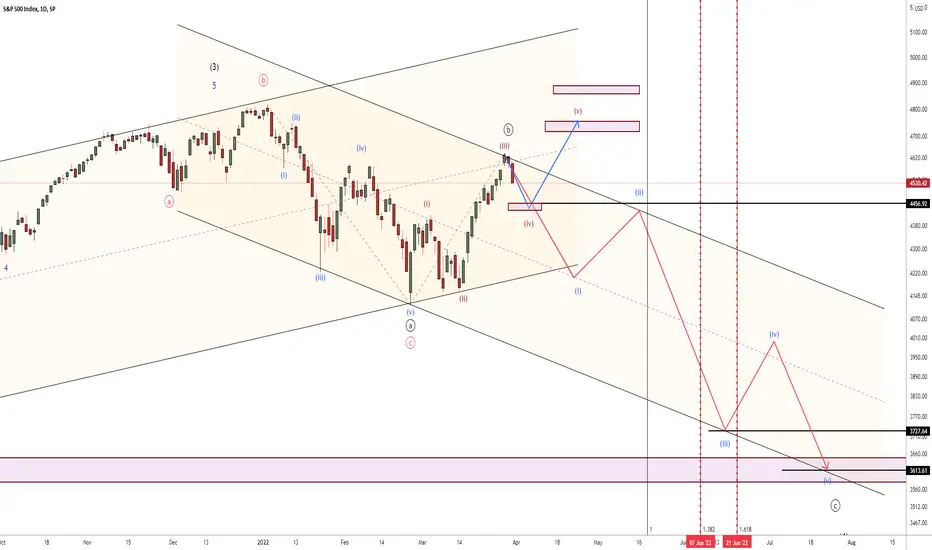
there are two scenarios in this chart.
1. if correction is over we follow Blueline
2. if we are in B wave then we follow Red line to 372 approx around mid-June
1. if correction is over we follow Blueline
2. if we are in B wave then we follow Red line to 372 approx around mid-June
Trade fermée: cible de profit atteinte

Clause de non-responsabilité
Les informations et publications ne sont pas destinées à être, et ne constituent pas, des conseils ou recommandations financiers, d'investissement, de trading ou autres fournis ou approuvés par TradingView. Pour en savoir plus, consultez les Conditions d'utilisation.
Clause de non-responsabilité
Les informations et publications ne sont pas destinées à être, et ne constituent pas, des conseils ou recommandations financiers, d'investissement, de trading ou autres fournis ou approuvés par TradingView. Pour en savoir plus, consultez les Conditions d'utilisation.