
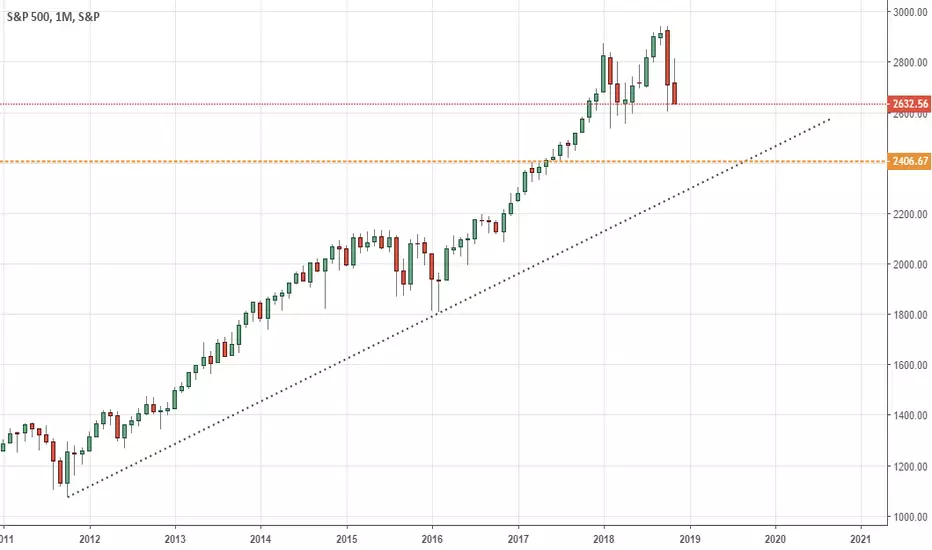
We are looking at a long-term chart that will tell us a lot of information that corresponds to the world economy.
Pay attention to the highlighted areas for a bounce or break!

We will keep an eye on the 2.400 AREA should the price break down further.
* the area with the most momentum is currently the short side because the US economy is fundamentally slowing down at the moment.
For more information:
drive.google.com/open?id=1zkulMZ22W4DY5r7hzHPgkADqMnlUnQ2d
Pay attention to the highlighted areas for a bounce or break!
We will keep an eye on the 2.400 AREA should the price break down further.
* the area with the most momentum is currently the short side because the US economy is fundamentally slowing down at the moment.
For more information:
drive.google.com/open?id=1zkulMZ22W4DY5r7hzHPgkADqMnlUnQ2d
Note
Coming for the retest

Clause de non-responsabilité
Les informations et publications ne sont pas destinées à être, et ne constituent pas, des conseils ou recommandations financiers, d'investissement, de trading ou autres fournis ou approuvés par TradingView. Pour en savoir plus, consultez les Conditions d'utilisation.
Clause de non-responsabilité
Les informations et publications ne sont pas destinées à être, et ne constituent pas, des conseils ou recommandations financiers, d'investissement, de trading ou autres fournis ou approuvés par TradingView. Pour en savoir plus, consultez les Conditions d'utilisation.