
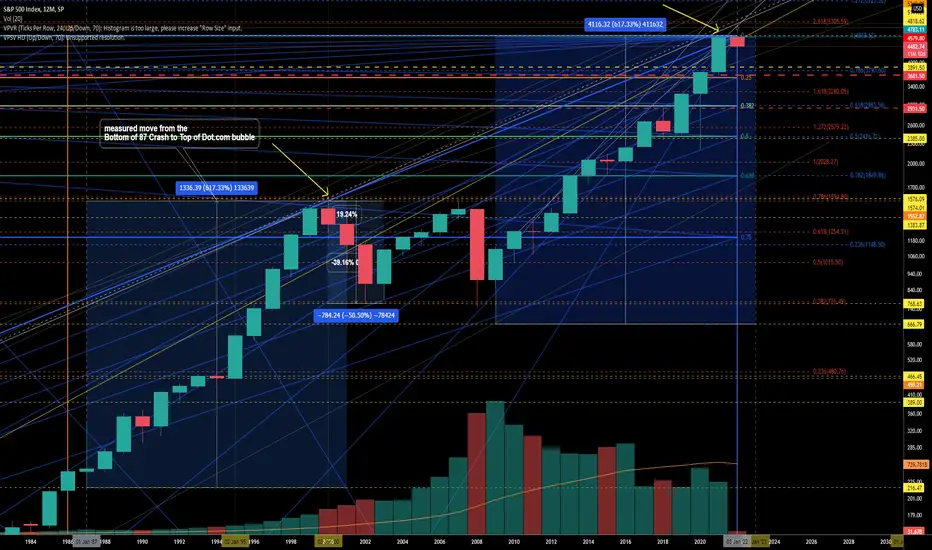
Months back I decided to attempt to predict a local topping of the S&P 500 in various ways. One symbolic aspect was to compare the moves of a previous crash to an asset bubble top... Simply measured the bottom of the '87 Crash to the top of the Dot.com Bubble -- I measured from the bottom of the Financial crisis crash to where that equal percentage move would be. In hindsight, I find this even more interesting over the past few weeks... Thus far, the recent topping was near 35 points of the symbolic measured move.

Clause de non-responsabilité
Les informations et publications ne sont pas destinées à être, et ne constituent pas, des conseils ou recommandations financiers, d'investissement, de trading ou autres fournis ou approuvés par TradingView. Pour en savoir plus, consultez les Conditions d'utilisation.
Clause de non-responsabilité
Les informations et publications ne sont pas destinées à être, et ne constituent pas, des conseils ou recommandations financiers, d'investissement, de trading ou autres fournis ou approuvés par TradingView. Pour en savoir plus, consultez les Conditions d'utilisation.