
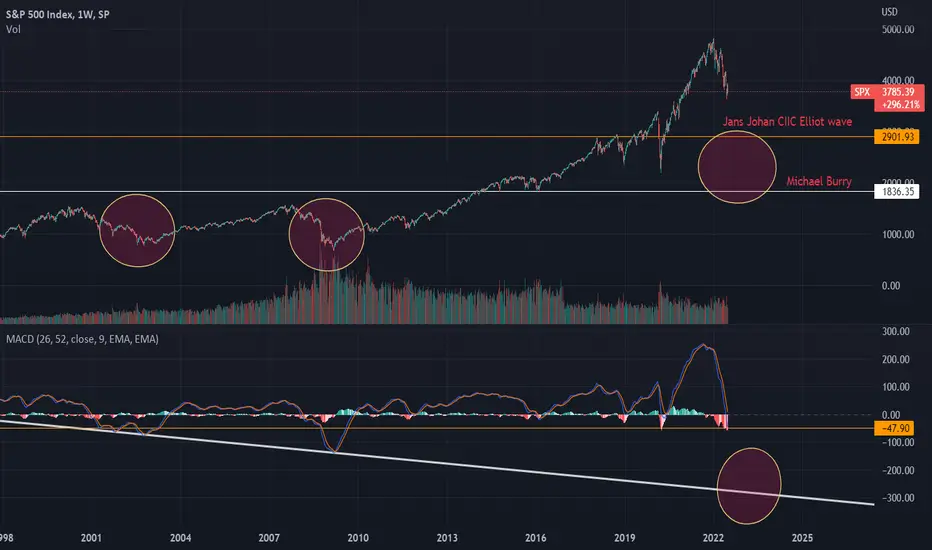
On a long-term weekly chart of the S&P 500, I have noticed that the MACD can give us an idea by its downtrend (white line) of when we might hit the bottom of the bear market. Being long-term, this could be from 6 months to more than a year. Combined with our Elliot Waves and Michael Burry's prediction we have an interval for the S&P 500 to fall from its current value between (20% & 48%) that the market has yet to fall.
The good thing about this is that home prices could plummet from rising mortgage rates.
For those who trade long crypto, and/or S&P 500 maybe it would be better to come back later.
The good thing about this is that home prices could plummet from rising mortgage rates.
For those who trade long crypto, and/or S&P 500 maybe it would be better to come back later.

Clause de non-responsabilité
Les informations et publications ne sont pas destinées à être, et ne constituent pas, des conseils ou recommandations financiers, d'investissement, de trading ou autres fournis ou approuvés par TradingView. Pour en savoir plus, consultez les Conditions d'utilisation.
Clause de non-responsabilité
Les informations et publications ne sont pas destinées à être, et ne constituent pas, des conseils ou recommandations financiers, d'investissement, de trading ou autres fournis ou approuvés par TradingView. Pour en savoir plus, consultez les Conditions d'utilisation.