
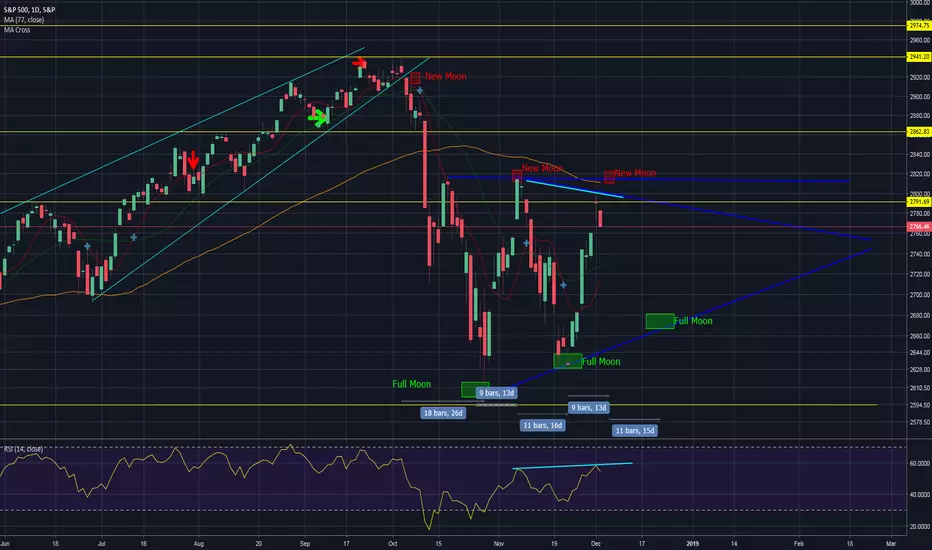
We can see here how the highs and lows form, and how they coincide with the phases of the moon. Something to keep in mind when making your trading decisions.
Bearish Divergence forming on Daily candle chart. Possible bear flag
Not investment advice. Theoretical ideas, only.
Bearish Divergence forming on Daily candle chart. Possible bear flag
Not investment advice. Theoretical ideas, only.

Clause de non-responsabilité
Les informations et publications ne sont pas destinées à être, et ne constituent pas, des conseils ou recommandations financiers, d'investissement, de trading ou autres fournis ou approuvés par TradingView. Pour en savoir plus, consultez les Conditions d'utilisation.
Clause de non-responsabilité
Les informations et publications ne sont pas destinées à être, et ne constituent pas, des conseils ou recommandations financiers, d'investissement, de trading ou autres fournis ou approuvés par TradingView. Pour en savoir plus, consultez les Conditions d'utilisation.