
Analyzing the market is not about predicting the future; it is about mapping the probabilities of human collective behavior.
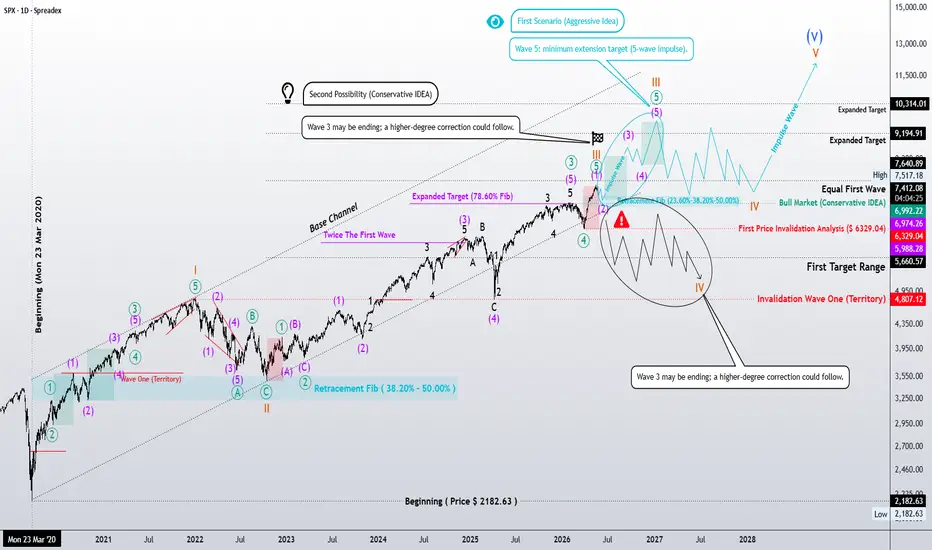
On this daily chart, we are observing a significant structural junction in the S&P 500. By applying the Elliott Wave Principle on a logarithmic scale, we can identify a complex hierarchy of waves that whisper the current state of market sentiment.
The Educational Perspective
We are currently scrutinizing the transition between the ending of a mature impulse wave and the beginning of a corrective process.
The Aggressive View: Suggests that the current structure is carving out the final segments of a 5-wave impulse. If this holds, the market remains in a strong state of expansion, targeting higher Fibonacci extensions.
The Conservative View (The “Breathing” Phase): We must respect the Rule of Alternation. Having witnessed a sharp Wave 2, the current structure suggests a sideways correction for Wave 4 (Flat, Triangle, or a complex combination like WXY). This is not a market collapse; it is a healthy, time-consuming rebalancing act—a “breathing phase” required for the health of the broader Bull Market.
The Art of Doubt
As analysts, we must embrace doubt. When I look at this chart, I don’t see a straight line to prosperity; I see a series of invalidation levels and structural checkpoints. The Invalidation Level at $6329.04 is our guardrail. If the market violates this, the structural thesis must be re-evaluated.
Market analysis is an exercise in humility: we prepare for the most likely scenario, but we always carry a “map of alternatives.”
Market Sentiment
Current sentiment is in a state of high-alert equilibrium. The market is oscillating between the fear of a local top and the greed of continued momentum. This indecision is exactly what defines a high-probability turning point.
Signature:
Patterns whisper… I listen.
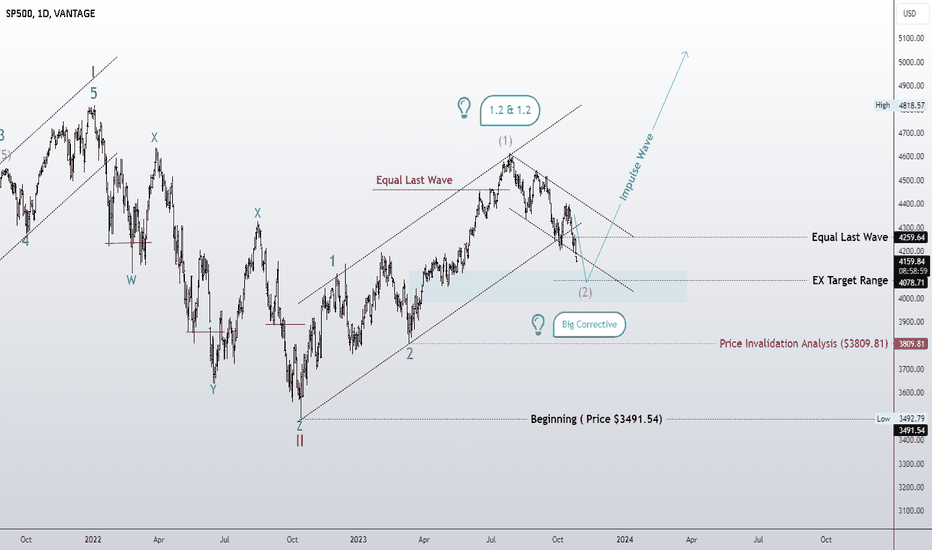
On this daily chart, we are observing a significant structural junction in the S&P 500. By applying the Elliott Wave Principle on a logarithmic scale, we can identify a complex hierarchy of waves that whisper the current state of market sentiment.
The Educational Perspective
We are currently scrutinizing the transition between the ending of a mature impulse wave and the beginning of a corrective process.
The Aggressive View: Suggests that the current structure is carving out the final segments of a 5-wave impulse. If this holds, the market remains in a strong state of expansion, targeting higher Fibonacci extensions.
The Conservative View (The “Breathing” Phase): We must respect the Rule of Alternation. Having witnessed a sharp Wave 2, the current structure suggests a sideways correction for Wave 4 (Flat, Triangle, or a complex combination like WXY). This is not a market collapse; it is a healthy, time-consuming rebalancing act—a “breathing phase” required for the health of the broader Bull Market.
The Art of Doubt
As analysts, we must embrace doubt. When I look at this chart, I don’t see a straight line to prosperity; I see a series of invalidation levels and structural checkpoints. The Invalidation Level at $6329.04 is our guardrail. If the market violates this, the structural thesis must be re-evaluated.
Market analysis is an exercise in humility: we prepare for the most likely scenario, but we always carry a “map of alternatives.”
Market Sentiment
Current sentiment is in a state of high-alert equilibrium. The market is oscillating between the fear of a local top and the greed of continued momentum. This indecision is exactly what defines a high-probability turning point.
Signature:
Patterns whisper… I listen.

Publications connexes
Clause de non-responsabilité
Les informations et publications ne sont pas destinées à être, et ne constituent pas, des conseils ou recommandations financiers, d'investissement, de trading ou autres fournis ou approuvés par TradingView. Pour en savoir plus, consultez les Conditions d'utilisation.
Publications connexes
Clause de non-responsabilité
Les informations et publications ne sont pas destinées à être, et ne constituent pas, des conseils ou recommandations financiers, d'investissement, de trading ou autres fournis ou approuvés par TradingView. Pour en savoir plus, consultez les Conditions d'utilisation.