
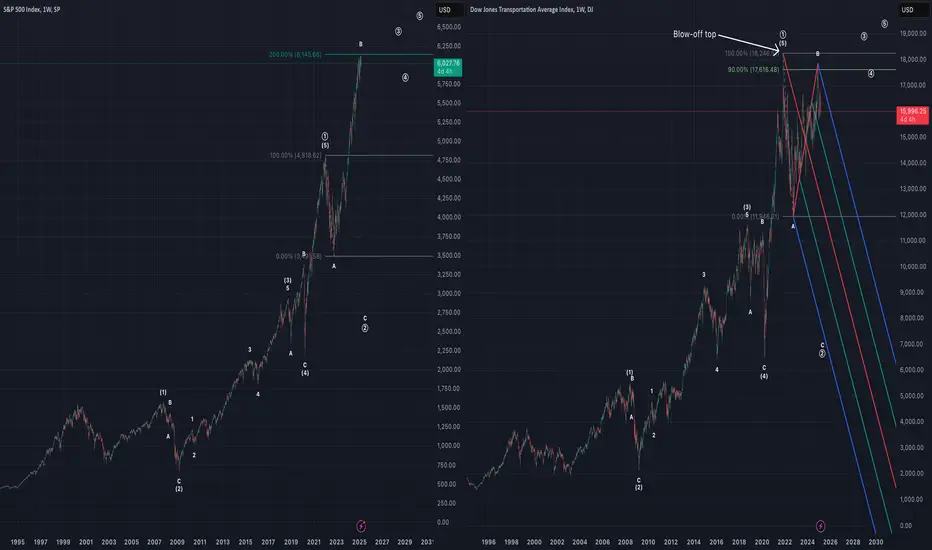
Chart comparing SPX and DJT.
This count has SPX and DJT in wave ((2)) of ((5)), with wave ((2)) of SPX as an expanded flat and wave ((2)) of DJT as a regular flat.
For SPX, wave B of the expanded flat ends up being 200% of wave A (nearly to the tic). For DJT, wave B of the regular flat ends up being ~90% of wave A.
If correct, would expect wave C to target March 2020 lows.
This count has SPX and DJT in wave ((2)) of ((5)), with wave ((2)) of SPX as an expanded flat and wave ((2)) of DJT as a regular flat.
For SPX, wave B of the expanded flat ends up being 200% of wave A (nearly to the tic). For DJT, wave B of the regular flat ends up being ~90% of wave A.
If correct, would expect wave C to target March 2020 lows.

Clause de non-responsabilité
Les informations et publications ne sont pas destinées à être, et ne constituent pas, des conseils ou recommandations financiers, d'investissement, de trading ou autres fournis ou approuvés par TradingView. Pour en savoir plus, consultez les Conditions d'utilisation.
Clause de non-responsabilité
Les informations et publications ne sont pas destinées à être, et ne constituent pas, des conseils ou recommandations financiers, d'investissement, de trading ou autres fournis ou approuvés par TradingView. Pour en savoir plus, consultez les Conditions d'utilisation.