
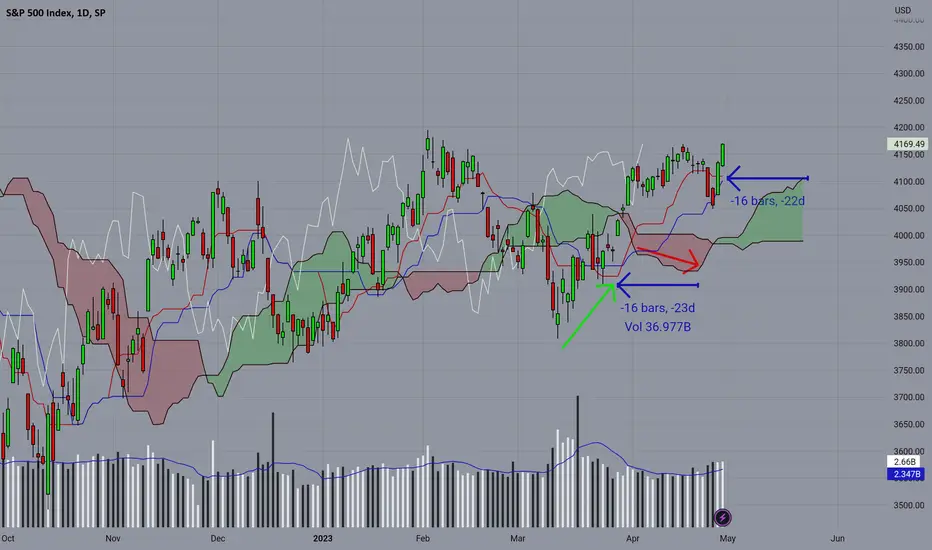
Here we have a 16 bar lag. The price breaches bearish and then beltlines bullish, and the red cloud continues bearish around the bullish low. Note: a signal for a lower low but price is a higher low is a reverse bullish signal. This example is a reverse bullish divergence signal methodology.

Clause de non-responsabilité
Les informations et publications ne sont pas destinées à être, et ne constituent pas, des conseils ou recommandations financiers, d'investissement, de trading ou autres fournis ou approuvés par TradingView. Pour en savoir plus, consultez les Conditions d'utilisation.
Clause de non-responsabilité
Les informations et publications ne sont pas destinées à être, et ne constituent pas, des conseils ou recommandations financiers, d'investissement, de trading ou autres fournis ou approuvés par TradingView. Pour en savoir plus, consultez les Conditions d'utilisation.