
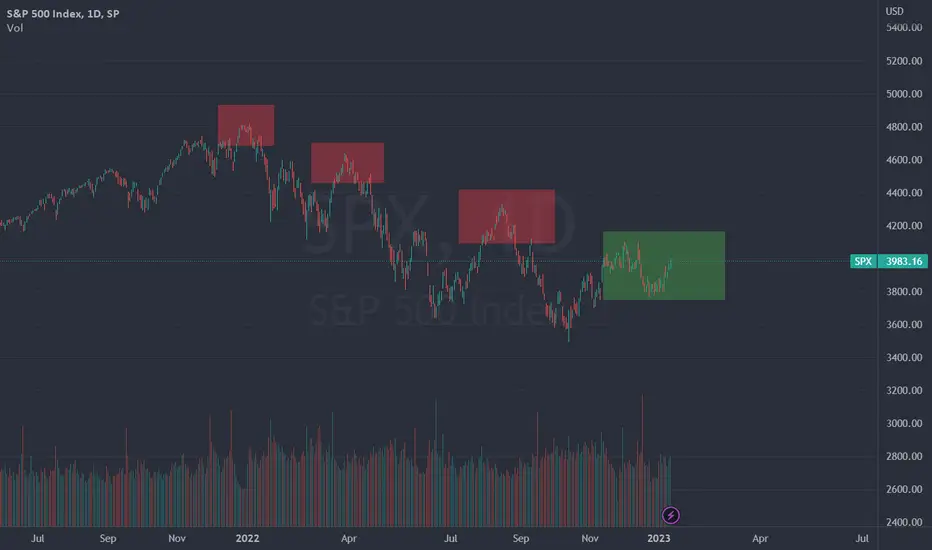
Quick post to those of you who've been following some of my ideas. I had previously drawn the similarity between now and 2008 in terms of chart patterns, but what's playing out seems to be much more like 1968 and 2001. Notice the double tops in green before the crash both had, which closely resembles what we're headed for now. These were also the starts of boom bust cycles happening in sets of 2. With this in mind, I'm adjusting to the 2001 timeline. My new PT is $265 which would hypothetically be at the end of August.


Publications connexes
Clause de non-responsabilité
Les informations et publications ne sont pas destinées à être, et ne constituent pas, des conseils ou recommandations financiers, d'investissement, de trading ou autres fournis ou approuvés par TradingView. Pour en savoir plus, consultez les Conditions d'utilisation.
Publications connexes
Clause de non-responsabilité
Les informations et publications ne sont pas destinées à être, et ne constituent pas, des conseils ou recommandations financiers, d'investissement, de trading ou autres fournis ou approuvés par TradingView. Pour en savoir plus, consultez les Conditions d'utilisation.