
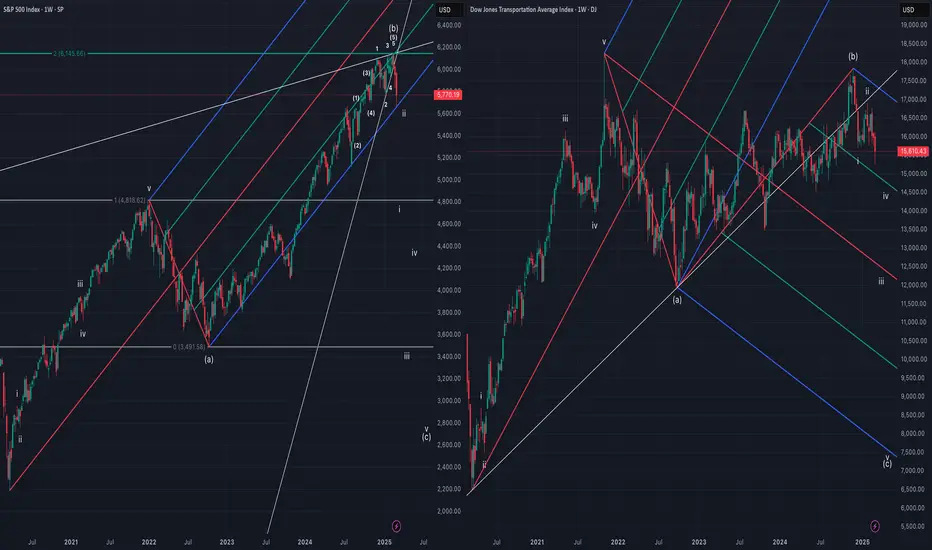
Chart comparing SPX and DJT.
SPX drawn with expanded flat, (b) is 200% of (a) and completes with ending diagonal wedge.
DJT drawn with regular flat, (b) ~90% of (a), wave (c) began in November of 2024 and currently in wave iii of (c).
Bears looking for SPX pitchfork support to break and become resistance, both SPX and DJT looking to eventually break October 2022 low and approach March 2020 lows to complete their corrective structures.

Clause de non-responsabilité
Les informations et publications ne sont pas destinées à être, et ne constituent pas, des conseils ou recommandations financiers, d'investissement, de trading ou autres fournis ou approuvés par TradingView. Pour en savoir plus, consultez les Conditions d'utilisation.
Clause de non-responsabilité
Les informations et publications ne sont pas destinées à être, et ne constituent pas, des conseils ou recommandations financiers, d'investissement, de trading ou autres fournis ou approuvés par TradingView. Pour en savoir plus, consultez les Conditions d'utilisation.