
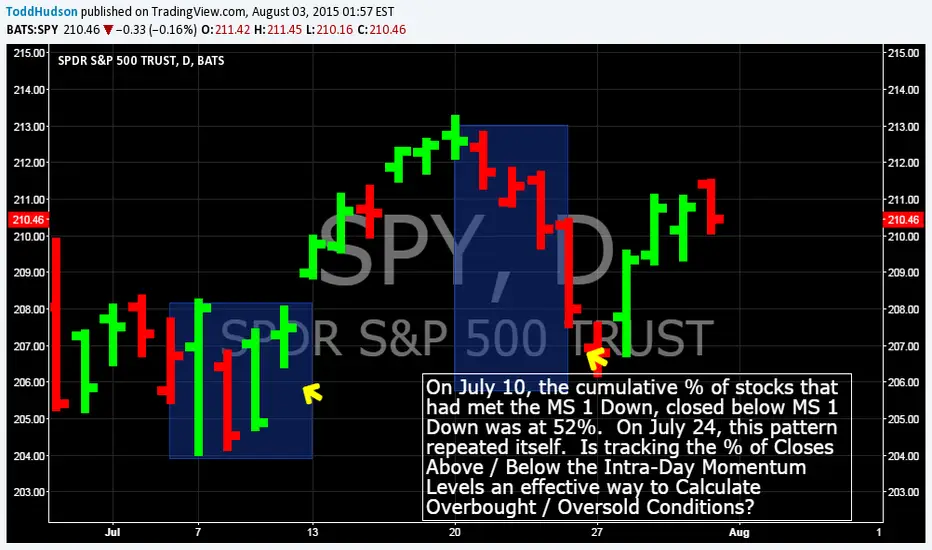
On July 10, the cumulative % of stocks that had met the MS 1 Down, closed below MS 1 Down was at 52%. On July 24, this pattern repeated itself. Is tracking the % of Closes Above / Below the Intra-Day Momentum Levels an effective way to Calculate Overbought / Oversold Conditions?

Clause de non-responsabilité
Les informations et publications ne sont pas destinées à être, et ne constituent pas, des conseils ou recommandations financiers, d'investissement, de trading ou autres fournis ou approuvés par TradingView. Pour en savoir plus, consultez les Conditions d'utilisation.
Clause de non-responsabilité
Les informations et publications ne sont pas destinées à être, et ne constituent pas, des conseils ou recommandations financiers, d'investissement, de trading ou autres fournis ou approuvés par TradingView. Pour en savoir plus, consultez les Conditions d'utilisation.