
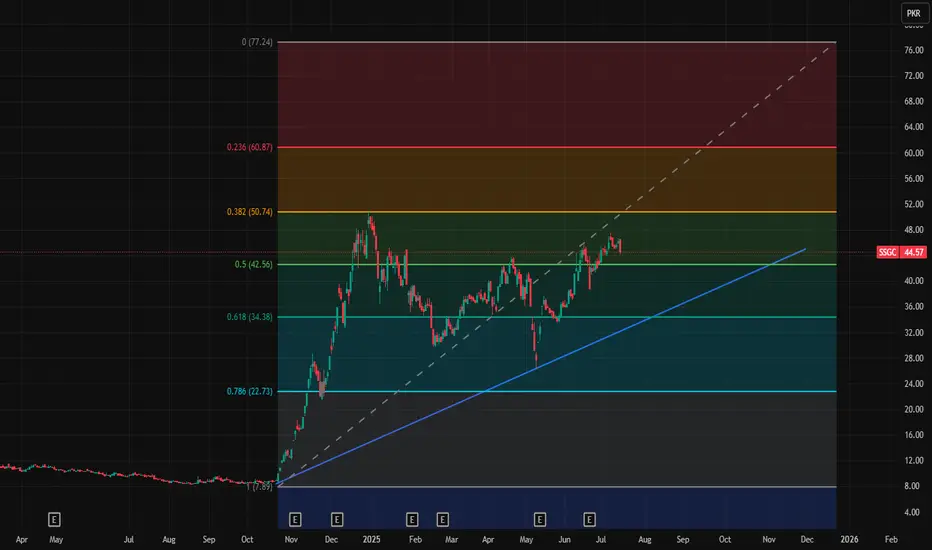
This is SSGC daily chart and you can watch blue trend line is its strong support and sustainability. It is growing day by day in long term.
These are key levels 34.38, 42.58, 50.74, 60.87 and 77.24
Note: This is not a buy/sell trade call. It is an analysis.
These are key levels 34.38, 42.58, 50.74, 60.87 and 77.24
Note: This is not a buy/sell trade call. It is an analysis.

Clause de non-responsabilité
Les informations et publications ne sont pas destinées à être, et ne constituent pas, des conseils ou recommandations financiers, d'investissement, de trading ou autres fournis ou approuvés par TradingView. Pour en savoir plus, consultez les Conditions d'utilisation.
Clause de non-responsabilité
Les informations et publications ne sont pas destinées à être, et ne constituent pas, des conseils ou recommandations financiers, d'investissement, de trading ou autres fournis ou approuvés par TradingView. Pour en savoir plus, consultez les Conditions d'utilisation.