
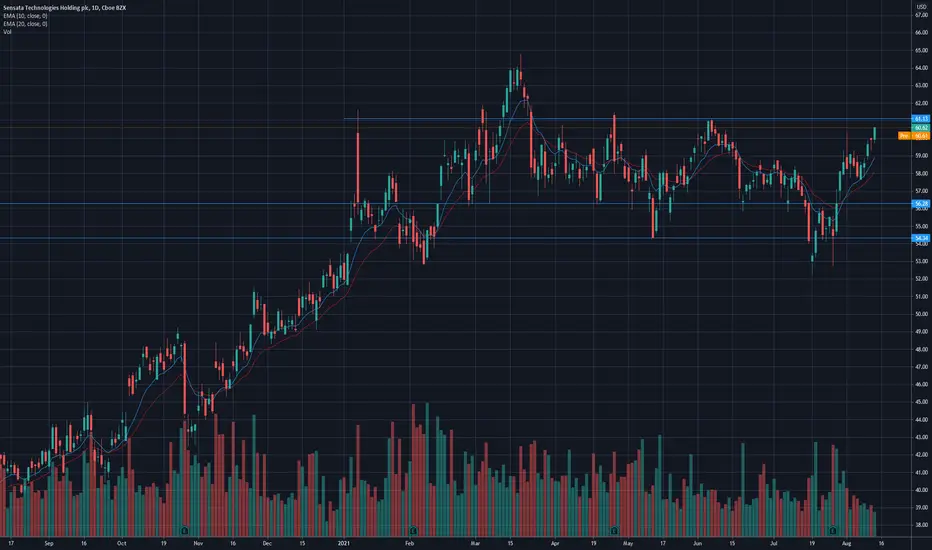
After using the highs from 2015 and 2018 ($56.28) as support, ST is now approaching the resistance of $61.13. Also note that ST has been ranging from year-to-date between $56.28 and $61.13.
Judging from the price action, it seems like ST may break and close above $61.13 in the coming week.
A rejection from $61.13 could have ST test the support of $59.90
Look for buying opportunities:
* Around the $59.90 area
OR
* After a daily close above $61.13
Judging from the price action, it seems like ST may break and close above $61.13 in the coming week.
A rejection from $61.13 could have ST test the support of $59.90
Look for buying opportunities:
* Around the $59.90 area
OR
* After a daily close above $61.13

Clause de non-responsabilité
Les informations et publications ne sont pas destinées à être, et ne constituent pas, des conseils ou recommandations financiers, d'investissement, de trading ou autres fournis ou approuvés par TradingView. Pour en savoir plus, consultez les Conditions d'utilisation.
Clause de non-responsabilité
Les informations et publications ne sont pas destinées à être, et ne constituent pas, des conseils ou recommandations financiers, d'investissement, de trading ou autres fournis ou approuvés par TradingView. Pour en savoir plus, consultez les Conditions d'utilisation.