
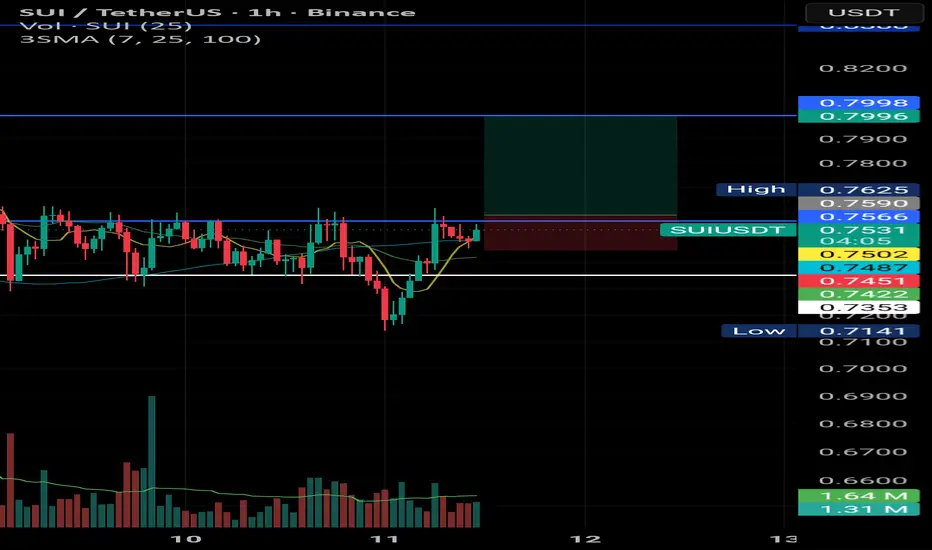
After a fake breakdown below the range low at 0.7353, price managed to reclaim the range and is now testing the 0.7566 resistance level.
A breakout above this level would complete a V-shaped recovery and could increase the probability of further upside.
Momentum indicators are showing signs of strengthening, with RSI moving toward the overbought region, suggesting growing buying pressure.
In this scenario, the next key levels to watch are 0.7998 and 0.8388.
A breakout above this level would complete a V-shaped recovery and could increase the probability of further upside.
Momentum indicators are showing signs of strengthening, with RSI moving toward the overbought region, suggesting growing buying pressure.
In this scenario, the next key levels to watch are 0.7998 and 0.8388.

Clause de non-responsabilité
Les informations et publications ne sont pas destinées à être, et ne constituent pas, des conseils ou recommandations financiers, d'investissement, de trading ou autres fournis ou approuvés par TradingView. Pour en savoir plus, consultez les Conditions d'utilisation.
Clause de non-responsabilité
Les informations et publications ne sont pas destinées à être, et ne constituent pas, des conseils ou recommandations financiers, d'investissement, de trading ou autres fournis ou approuvés par TradingView. Pour en savoir plus, consultez les Conditions d'utilisation.