
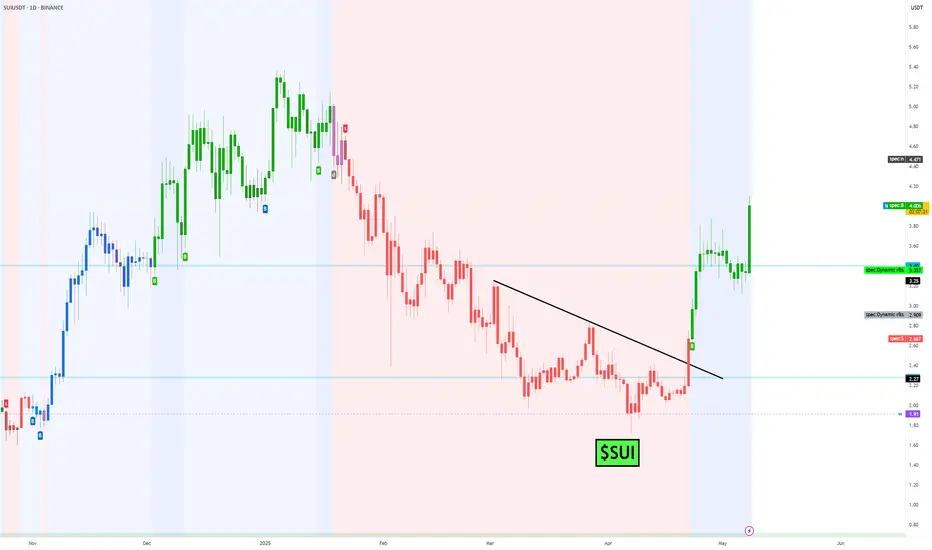
SUI’s daily chart embodies textbook base‐and‐breakout dynamics. Having bottomed near $1.91, reclaimed key demand at $2.28, and smashed through successive dynamic resistances, the chart now projects a clear path toward prior supply at $4.60 and beyond. That said, every breakout merits healthy skepticism: a retest of the $3.35–3.60 zone—and its ability to hold—will be the acid test of true strength.
Next Steps for the Trader/Investor: monitor volume and price action in the coming sessions, be ready to buy on a clean retest, and manage risk tightly below invalidation levels. If SUI can sustain above $4.00 and flip former resistance into support, we may be witnessing the dawn of its next up-cycle.
Next Steps for the Trader/Investor: monitor volume and price action in the coming sessions, be ready to buy on a clean retest, and manage risk tightly below invalidation levels. If SUI can sustain above $4.00 and flip former resistance into support, we may be witnessing the dawn of its next up-cycle.

See in reality
Clause de non-responsabilité
Les informations et publications ne sont pas destinées à être, et ne constituent pas, des conseils ou recommandations financiers, d'investissement, de trading ou autres fournis ou approuvés par TradingView. Pour en savoir plus, consultez les Conditions d'utilisation.
See in reality
Clause de non-responsabilité
Les informations et publications ne sont pas destinées à être, et ne constituent pas, des conseils ou recommandations financiers, d'investissement, de trading ou autres fournis ou approuvés par TradingView. Pour en savoir plus, consultez les Conditions d'utilisation.