SUNTV1!
27-11
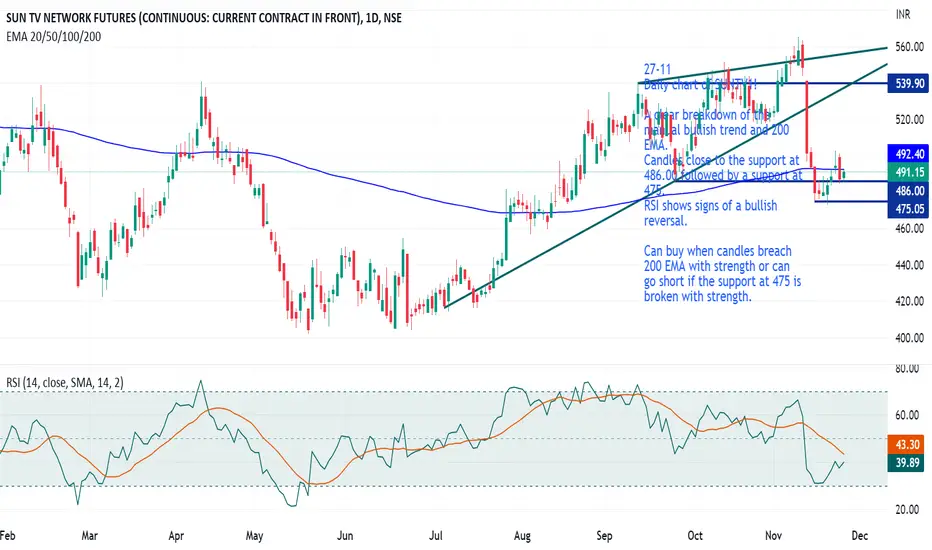
Daily chart of SUNTV1!
A clear breakdown of the manual bullish trend and 200 EMA.
Candles close to the support at 486.00 followed by a support at 475.
RSI shows signs of a bullish reversal.
Can buy when candles breach 200 EMA with strength or can go short if the support at 475 is broken with strength.
Daily chart of SUNTV1!
A clear breakdown of the manual bullish trend and 200 EMA.
Candles close to the support at 486.00 followed by a support at 475.
RSI shows signs of a bullish reversal.
Can buy when candles breach 200 EMA with strength or can go short if the support at 475 is broken with strength.

Clause de non-responsabilité
Les informations et publications ne sont pas destinées à être, et ne constituent pas, des conseils ou recommandations financiers, d'investissement, de trading ou autres fournis ou approuvés par TradingView. Pour en savoir plus, consultez les Conditions d'utilisation.
Clause de non-responsabilité
Les informations et publications ne sont pas destinées à être, et ne constituent pas, des conseils ou recommandations financiers, d'investissement, de trading ou autres fournis ou approuvés par TradingView. Pour en savoir plus, consultez les Conditions d'utilisation.