
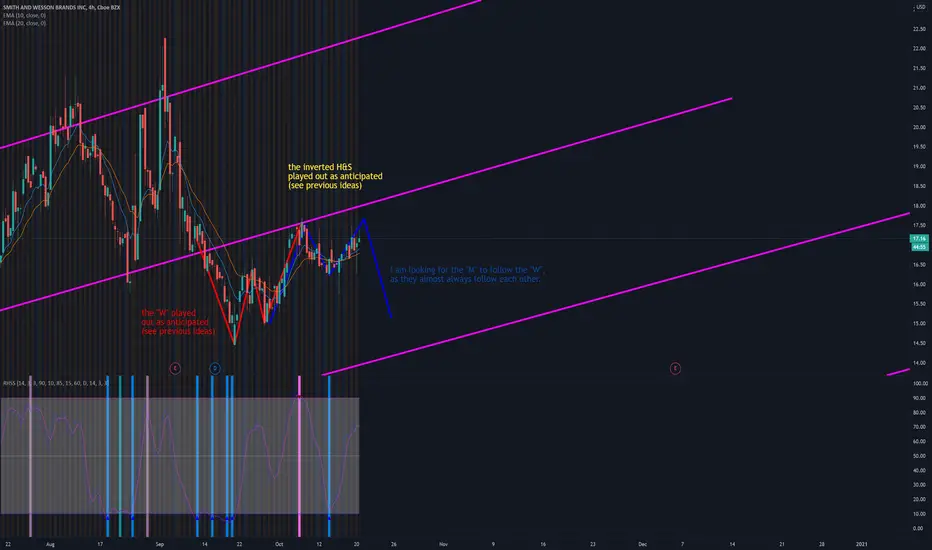
trading off the 10 & 20 EMAs, the daily is about to confirm the retest and signal an uptrend on the daily (green candle closing above the EMA cloud with the 10 over the 20) which could easily invalidate the idea published here: breaking down the right side of the blue "M".
If the "M" does play our as depicted, it will simply paint a larger "W" with an upside around $20, the resistance from our most recent major high.
If the "M" does play our as depicted, it will simply paint a larger "W" with an upside around $20, the resistance from our most recent major high.
Trade fermée: cible de profit atteinte
the M ran to its bottom against the lower side of the current channel.
Clause de non-responsabilité
Les informations et publications ne sont pas destinées à être, et ne constituent pas, des conseils ou recommandations financiers, d'investissement, de trading ou autres fournis ou approuvés par TradingView. Pour en savoir plus, consultez les Conditions d'utilisation.
Clause de non-responsabilité
Les informations et publications ne sont pas destinées à être, et ne constituent pas, des conseils ou recommandations financiers, d'investissement, de trading ou autres fournis ou approuvés par TradingView. Pour en savoir plus, consultez les Conditions d'utilisation.