
AT&T is a mature US telecom company focused on wireless, broadband, and stable cash-flow generation rather than fast growth.
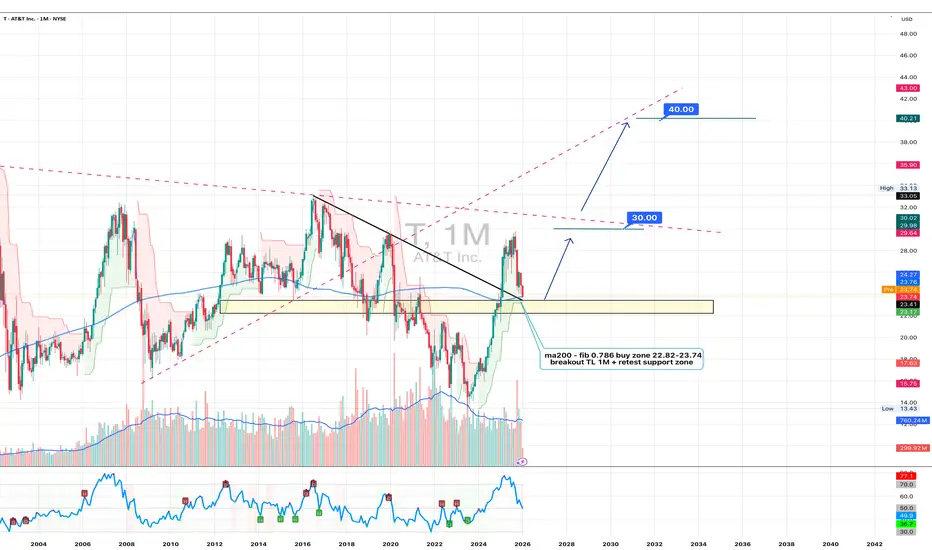
On the monthly chart, price has already broken the long-term descending trendline and is now trading back into a logical retest zone. The 22.8–23.7 area aligns with the 0.786 Fibonacci level and the monthly MA200, creating a technically dense support region. The pullback looks corrective rather than impulsive: volume expanded on the upside breakout and has been contracting during the retrace, which suggests a lack of aggressive selling pressure. Momentum indicators confirm a phase shift rather than weakness, with RSI holding well above historical lows and structure remaining intact. From a pure market structure perspective, this looks like digestion after a regime change, not a failure.
Fundamentally, AT&T remains a cash-flow story. Trailing twelve-month operating cash flow is around $40.9B, with free cash flow close to $20B, allowing the company to comfortably service debt and maintain shareholder returns. The dividend stands at $0.278 per share with a yield around 4.6%, paid quarterly, reinforcing AT&T’s defensive profile. Expectations for Q4 2025 point to EPS near $0.46 and revenue around $32.9B, steady rather than explosive, but consistent with a stabilizing balance sheet. This is not a growth narrative, it is a repricing of durability.
This is a slow, positional idea driven by the monthly timeframe. No drama, no hype, just the market gradually reassessing an asset that spent years under pressure. Sometimes boring charts are exactly where long-term clarity appears.
On the monthly chart, price has already broken the long-term descending trendline and is now trading back into a logical retest zone. The 22.8–23.7 area aligns with the 0.786 Fibonacci level and the monthly MA200, creating a technically dense support region. The pullback looks corrective rather than impulsive: volume expanded on the upside breakout and has been contracting during the retrace, which suggests a lack of aggressive selling pressure. Momentum indicators confirm a phase shift rather than weakness, with RSI holding well above historical lows and structure remaining intact. From a pure market structure perspective, this looks like digestion after a regime change, not a failure.
Fundamentally, AT&T remains a cash-flow story. Trailing twelve-month operating cash flow is around $40.9B, with free cash flow close to $20B, allowing the company to comfortably service debt and maintain shareholder returns. The dividend stands at $0.278 per share with a yield around 4.6%, paid quarterly, reinforcing AT&T’s defensive profile. Expectations for Q4 2025 point to EPS near $0.46 and revenue around $32.9B, steady rather than explosive, but consistent with a stabilizing balance sheet. This is not a growth narrative, it is a repricing of durability.
This is a slow, positional idea driven by the monthly timeframe. No drama, no hype, just the market gradually reassessing an asset that spent years under pressure. Sometimes boring charts are exactly where long-term clarity appears.

Наш канал: t.me/totoshkatradingteam
⏺ Брокеры которым доверяю:
FxPro - ib-fxpro.com/?ib=SwHtc7m3
AMarkets - profit-market.info/promo/?g=BZA6ZC
⏺ Брокеры которым доверяю:
FxPro - ib-fxpro.com/?ib=SwHtc7m3
AMarkets - profit-market.info/promo/?g=BZA6ZC
Clause de non-responsabilité
Les informations et publications ne sont pas destinées à être, et ne constituent pas, des conseils ou recommandations financiers, d'investissement, de trading ou autres fournis ou approuvés par TradingView. Pour en savoir plus, consultez les Conditions d'utilisation.
Наш канал: t.me/totoshkatradingteam
⏺ Брокеры которым доверяю:
FxPro - ib-fxpro.com/?ib=SwHtc7m3
AMarkets - profit-market.info/promo/?g=BZA6ZC
⏺ Брокеры которым доверяю:
FxPro - ib-fxpro.com/?ib=SwHtc7m3
AMarkets - profit-market.info/promo/?g=BZA6ZC
Clause de non-responsabilité
Les informations et publications ne sont pas destinées à être, et ne constituent pas, des conseils ou recommandations financiers, d'investissement, de trading ou autres fournis ou approuvés par TradingView. Pour en savoir plus, consultez les Conditions d'utilisation.