
Elliott Wave Count Suggests Wave (v) Breakout Building
Price: ₹569.55 on 14th July 2026 | Timeframe: Weekly
Structure Overview
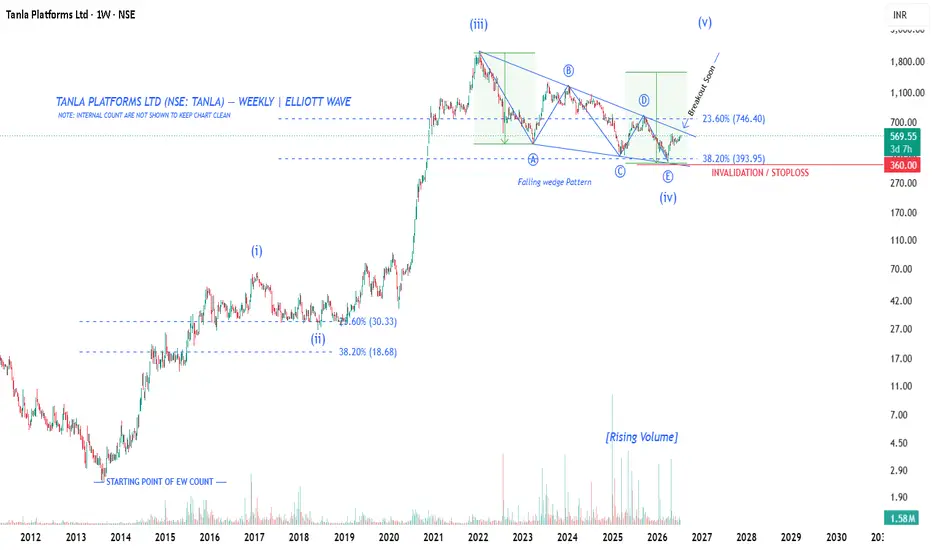
Tanla's long-term move from the 2020 lows appears to be unfolding as a five-wave impulse:
Wave (i): Initial rally off the base, retraced to the 38.2%–23.6% zone (₹18.68–₹30.33) before continuation.
Wave (iii): The dominant extended wave, driving price sharply from the ~₹100 zone to the swing high near ₹1,800–1,900.
Wave (iv): Currently unfolding as a complex corrective structure — labeled A-B-C-D-E — taking the shape of a contracting/falling wedge (triangle) pattern, a classic wave (iv) formation (triangles often appear in the 4th wave position per Elliott Wave theory).
Wave (v): Anticipated next leg higher, projected toward new highs above the wave (iii) peak.
Very Important Invalidation: A decisive weekly close below the level (₹360.0) as stop los / wedge lower boundary would put the bullish wave count at risk and suggest a deeper corrective structure instead.
Watch For
Volume expansion on the breakout candle
Retest of the wedge trendline as new support post-breakout
This is a technical/wave-count perspective for educational discussion, not financial advice. Elliott Wave counts are subjective and should be confirmed with additional confluence (volume, momentum, broader market context) before acting.
Price: ₹569.55 on 14th July 2026 | Timeframe: Weekly
Structure Overview
Tanla's long-term move from the 2020 lows appears to be unfolding as a five-wave impulse:
Wave (i): Initial rally off the base, retraced to the 38.2%–23.6% zone (₹18.68–₹30.33) before continuation.
Wave (iii): The dominant extended wave, driving price sharply from the ~₹100 zone to the swing high near ₹1,800–1,900.
Wave (iv): Currently unfolding as a complex corrective structure — labeled A-B-C-D-E — taking the shape of a contracting/falling wedge (triangle) pattern, a classic wave (iv) formation (triangles often appear in the 4th wave position per Elliott Wave theory).
Wave (v): Anticipated next leg higher, projected toward new highs above the wave (iii) peak.
Very Important Invalidation: A decisive weekly close below the level (₹360.0) as stop los / wedge lower boundary would put the bullish wave count at risk and suggest a deeper corrective structure instead.
Watch For
Volume expansion on the breakout candle
Retest of the wedge trendline as new support post-breakout
This is a technical/wave-count perspective for educational discussion, not financial advice. Elliott Wave counts are subjective and should be confirmed with additional confluence (volume, momentum, broader market context) before acting.

Clause de non-responsabilité
Les informations et publications ne sont pas destinées à être, et ne constituent pas, des conseils ou recommandations financiers, d'investissement, de trading ou autres fournis ou approuvés par TradingView. Pour en savoir plus, consultez les Conditions d'utilisation.
Clause de non-responsabilité
Les informations et publications ne sont pas destinées à être, et ne constituent pas, des conseils ou recommandations financiers, d'investissement, de trading ou autres fournis ou approuvés par TradingView. Pour en savoir plus, consultez les Conditions d'utilisation.