
📌 Current Price Reference
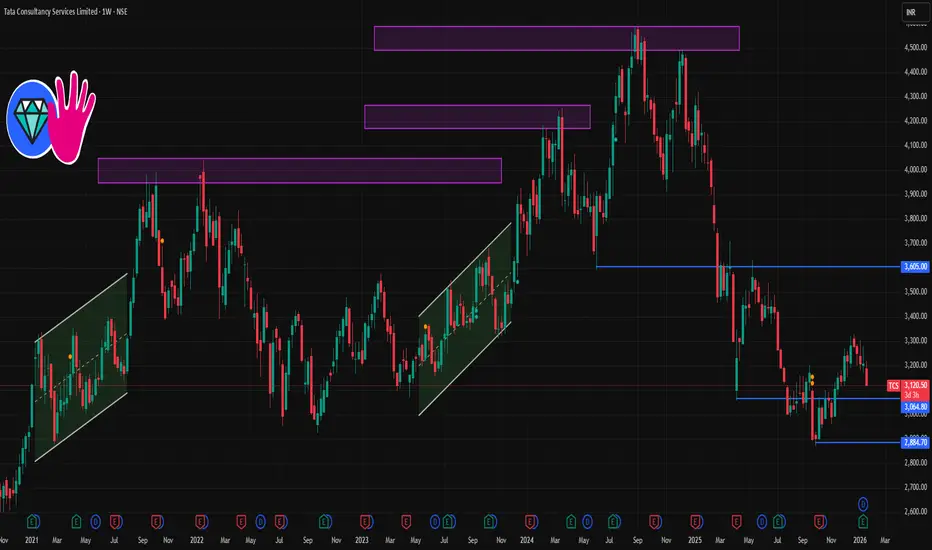
TCS is trading around ₹3,120–₹3,140 on the NSE recently.
📉 Key Weekly Levels (Support & Resistance)
🔹 Support Levels (Weekly)
1. ~₹3,137 – near immediate weekly support zone.
2. ~₹3,111 – next support under current price.
3. ~₹3,069 – deeper weekly support below recent lows.
4. ~₹2,867 – 52-week low area (major support if breakdown persists).
These levels are typical bounce/zones to watch on a weekly timeframe if the stock slides further.
🔺 Resistance Levels (Weekly)
1. ~₹3,205 – immediate weekly resistance.
2. ~₹3,246–₹3,273 – medium resistance that may cap upside rallies.
3. ~₹3,300+ – round psychological resistance zone.
A break above ~₹3,205–₹3,246 area on weekly closing could suggest short-term bullish momentum.
📌 1-Week Trading Range (Indicative)
Bearish/breakdown range: ₹3,069 – ₹2,867 (if weakness continues)
Neutral range: ₹3,069 – ₹3,205
Bullish breakout range: above ₹3,205 up to ₹3,273+

Contact Knowledgehub for a detailed consultation: Dm on WhatsApp: [wa.link/a2o0kz]-
Phone No: [+91 93102 26243]-
Email: [tradingviewknowledgehub@gmail.com]---
-- Let’s achieve success together!
Phone No: [+91 93102 26243]-
Email: [tradingviewknowledgehub@gmail.com]---
-- Let’s achieve success together!
Publications connexes
Clause de non-responsabilité
Les informations et publications ne sont pas destinées à être, et ne constituent pas, des conseils ou recommandations financiers, d'investissement, de trading ou autres fournis ou approuvés par TradingView. Pour en savoir plus, consultez les Conditions d'utilisation.