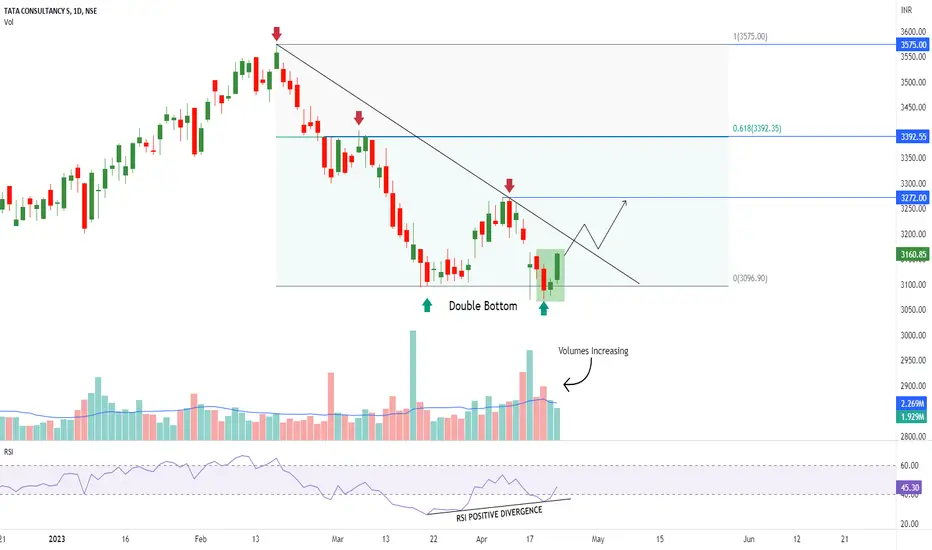
 TCS is trading at its important weekly support level.
On Daily chart it has formed kind of Morning Star Candlestick Pattern & Double Bottom Price Action Pattern.
Positive RSI Divergence is also seen.
Volume is still rising, which suggests that there is more upside potential for the stock.
- Support- 3100
Resistance- 3275/3400/3575

Clause de non-responsabilité
Les informations et publications ne sont pas destinées à être, et ne constituent pas, des conseils ou recommandations financiers, d'investissement, de trading ou autres fournis ou approuvés par TradingView. Pour en savoir plus, consultez les Conditions d'utilisation.
Clause de non-responsabilité
Les informations et publications ne sont pas destinées à être, et ne constituent pas, des conseils ou recommandations financiers, d'investissement, de trading ou autres fournis ou approuvés par TradingView. Pour en savoir plus, consultez les Conditions d'utilisation.