
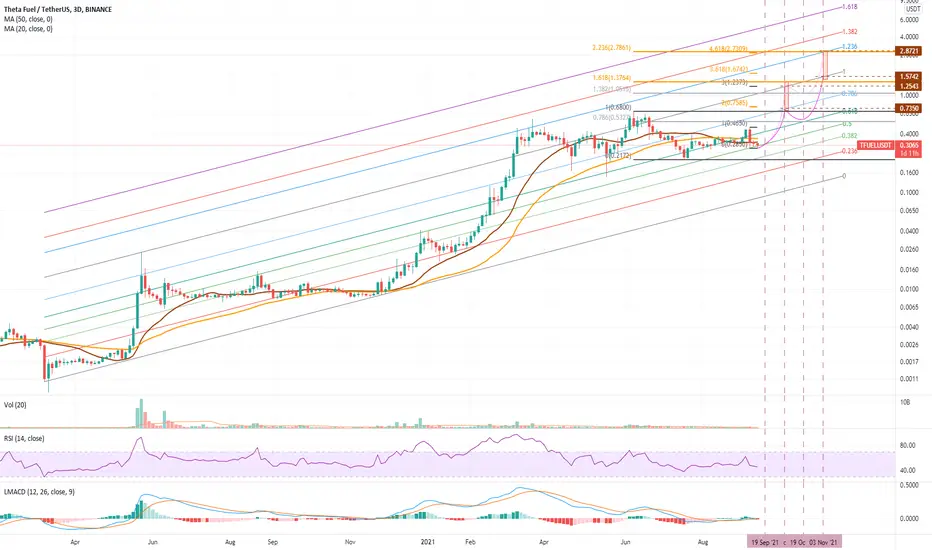
Re-running the TFUEL study in the Logarithmic scale and we see some clear and consistent structure to the market along the lines of a Fibonacci Channel.
Considering the completion of Wave 2 yesterday, this 3 Day Chart provides some insight and justification for higher targets for Wave 5.
Which do you think is more likely, the outcomes derived from previous Standard Scale chart or this Log Scale chart?
Considering the completion of Wave 2 yesterday, this 3 Day Chart provides some insight and justification for higher targets for Wave 5.
Which do you think is more likely, the outcomes derived from previous Standard Scale chart or this Log Scale chart?

Publications connexes
Clause de non-responsabilité
Les informations et publications ne sont pas destinées à être, et ne constituent pas, des conseils ou recommandations financiers, d'investissement, de trading ou autres fournis ou approuvés par TradingView. Pour en savoir plus, consultez les Conditions d'utilisation.