
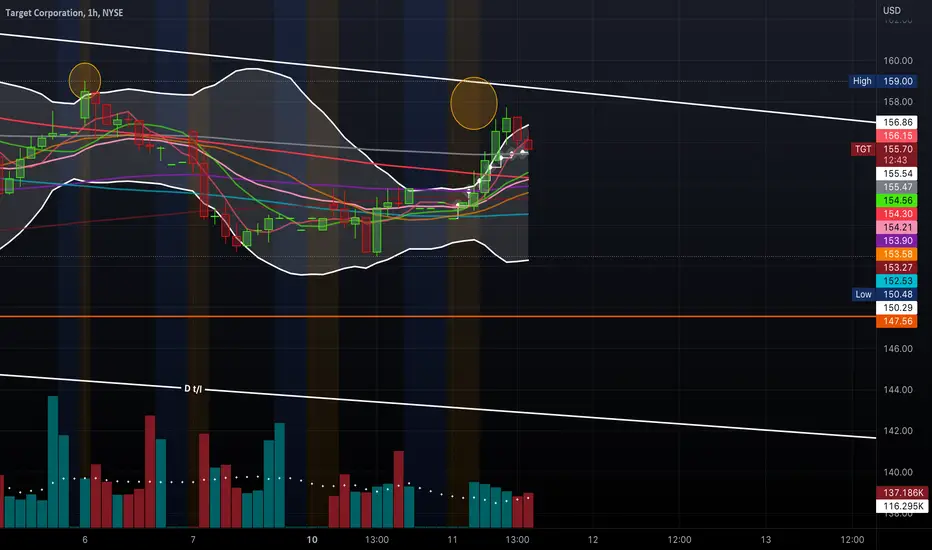
Target With A "Bullseye"?
I've identified a falling wedge pattern on Target's daily chart. Also, the RSI indicator shows higher highs and higher lows.
Short float % for TGT was at 2.02% at time of this post.
TGT is a good candidate for a swing. I have my "Bullseye" above 159 or at the break of the upper trendline.

*This is not financial advice.
I've identified a falling wedge pattern on Target's daily chart. Also, the RSI indicator shows higher highs and higher lows.
Short float % for TGT was at 2.02% at time of this post.
TGT is a good candidate for a swing. I have my "Bullseye" above 159 or at the break of the upper trendline.
*This is not financial advice.

Clause de non-responsabilité
Les informations et publications ne sont pas destinées à être, et ne constituent pas, des conseils ou recommandations financiers, d'investissement, de trading ou autres fournis ou approuvés par TradingView. Pour en savoir plus, consultez les Conditions d'utilisation.
Clause de non-responsabilité
Les informations et publications ne sont pas destinées à être, et ne constituent pas, des conseils ou recommandations financiers, d'investissement, de trading ou autres fournis ou approuvés par TradingView. Pour en savoir plus, consultez les Conditions d'utilisation.