
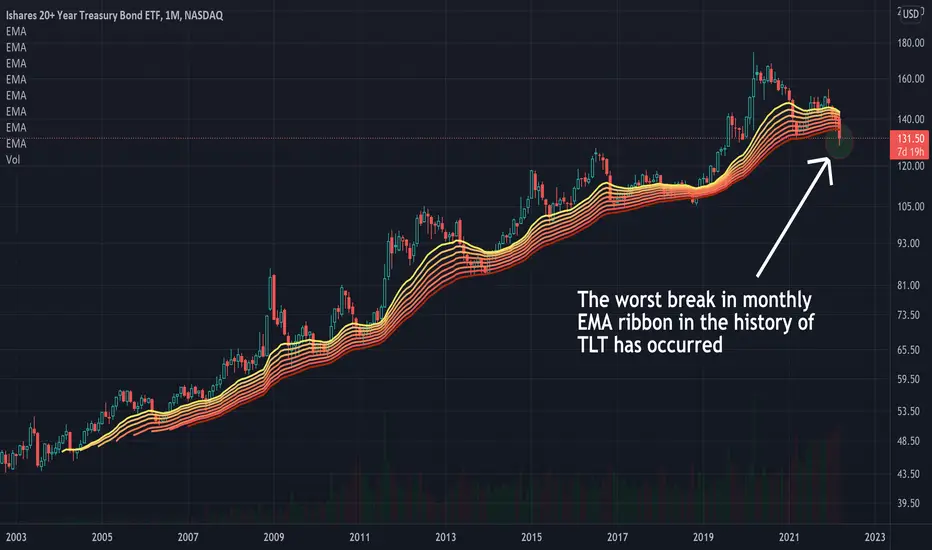
The iShares 20+ Year Treasury Bond ETF (TLT) tracks an index composed of U.S. Treasury bonds with maturities greater than twenty years. The price of TLT goes down as interest on 20+ year U.S. treasuries goes up. High inflation is driving interest rates ever higher. If inflation does not slow soon, a decades-long trend could end, as this chart is warning.
The monthly exponential moving average (EMA) ribbons have experienced their worse violation in the fund's 20 year history. Typically the monthly EMA ribbons act as very strong long term support. The lower 55 month EMA band can act as a low risk to reward long entry. The price at which the monthly candle closes is determinative.
Fortunately, there is roughly an 80% chance that the 20-year bull trend in the price of TLT will hold in March 2022. (This probability comes from the standard deviation from the monthly mean). So for now, at least, the trend is likely to continue. However, the chart suggests that the decades-long trend is dangerously close to breaking.
The monthly exponential moving average (EMA) ribbons have experienced their worse violation in the fund's 20 year history. Typically the monthly EMA ribbons act as very strong long term support. The lower 55 month EMA band can act as a low risk to reward long entry. The price at which the monthly candle closes is determinative.
Fortunately, there is roughly an 80% chance that the 20-year bull trend in the price of TLT will hold in March 2022. (This probability comes from the standard deviation from the monthly mean). So for now, at least, the trend is likely to continue. However, the chart suggests that the decades-long trend is dangerously close to breaking.

Clause de non-responsabilité
Les informations et publications ne sont pas destinées à être, et ne constituent pas, des conseils ou recommandations financiers, d'investissement, de trading ou autres fournis ou approuvés par TradingView. Pour en savoir plus, consultez les Conditions d'utilisation.
Clause de non-responsabilité
Les informations et publications ne sont pas destinées à être, et ne constituent pas, des conseils ou recommandations financiers, d'investissement, de trading ou autres fournis ou approuvés par TradingView. Pour en savoir plus, consultez les Conditions d'utilisation.