
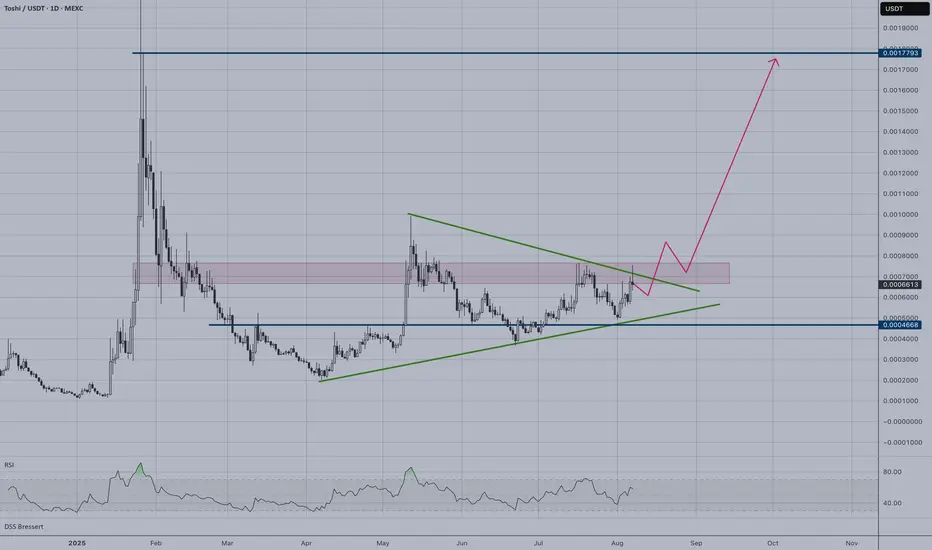
TOSHI is forming a classic symmetrical triangle pattern on the daily timeframe, indicating consolidation before a potential major move. The price has been compressed between converging support and resistance lines for several months.
Key Technical Observations:
Triangle pattern nearing apex completion
RSI shows neutral momentum around 50 level
Volume compression typical of triangle formations
Breakout Scenarios:
Bullish Breakout:
Target: 0.0017793 USDT (upper resistance zone)
Entry: Above triangle resistance with volume confirmation
Bearish Breakdown:
Target: 0.0004668 USDT (lower support zone)
Stop-loss consideration above breakdown level
Risk Management:
The triangle is in its final stages, making this a high-probability setup. However, false breakouts are common, so waiting for volume confirmation and a clean break of either trendline is crucial. The projected path suggests bullish bias, but traders should prepare for movement in either direction.
Key Technical Observations:
Triangle pattern nearing apex completion
RSI shows neutral momentum around 50 level
Volume compression typical of triangle formations
Breakout Scenarios:
Bullish Breakout:
Target: 0.0017793 USDT (upper resistance zone)
Entry: Above triangle resistance with volume confirmation
Bearish Breakdown:
Target: 0.0004668 USDT (lower support zone)
Stop-loss consideration above breakdown level
Risk Management:
The triangle is in its final stages, making this a high-probability setup. However, false breakouts are common, so waiting for volume confirmation and a clean break of either trendline is crucial. The projected path suggests bullish bias, but traders should prepare for movement in either direction.

Find top crypto tokens with sector indices, AI-powered sentiment analysis & news summaries.
tokenradar.ai/tv
tokenradar.ai/tv
Clause de non-responsabilité
Les informations et publications ne sont pas destinées à être, et ne constituent pas, des conseils ou recommandations financiers, d'investissement, de trading ou autres fournis ou approuvés par TradingView. Pour en savoir plus, consultez les Conditions d'utilisation.
Find top crypto tokens with sector indices, AI-powered sentiment analysis & news summaries.
tokenradar.ai/tv
tokenradar.ai/tv
Clause de non-responsabilité
Les informations et publications ne sont pas destinées à être, et ne constituent pas, des conseils ou recommandations financiers, d'investissement, de trading ou autres fournis ou approuvés par TradingView. Pour en savoir plus, consultez les Conditions d'utilisation.