
I noticed a similarity and thought I'd share
March 2020 Drop in PA was sudden and dramatic as was the V shape recovery.
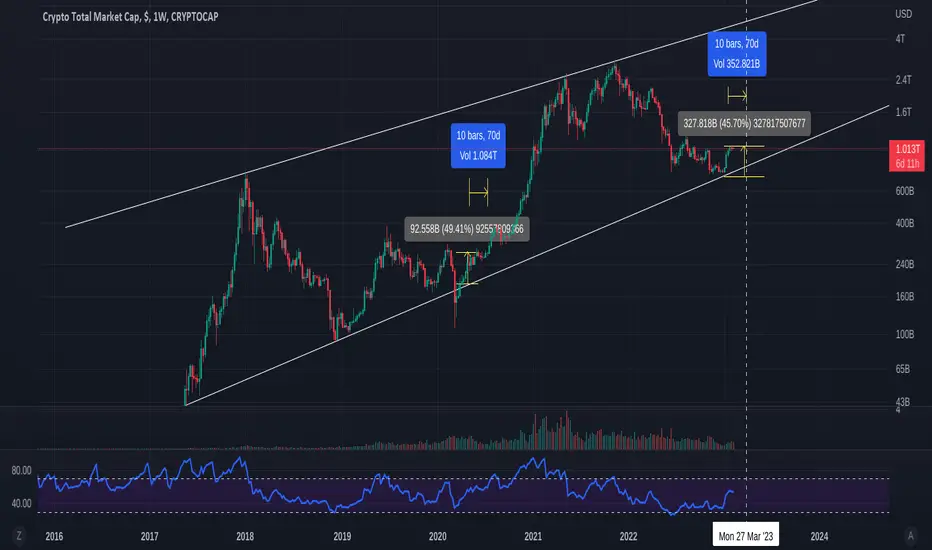
What I noticed was the % of rise from the long term trendline to where PA levelled out, while it cooled off before the next move and what PA has Just done.
And as you can see, it is very similar and if PA takes 70 days to cool off, as it did before, that takes us to end of March, Which has confluence with other charts about when PA maybe making another Move.
I will stress that this is pure speculation and has no real proof..It is an idea.......but one worth watching I feel
March 2020 Drop in PA was sudden and dramatic as was the V shape recovery.
What I noticed was the % of rise from the long term trendline to where PA levelled out, while it cooled off before the next move and what PA has Just done.
And as you can see, it is very similar and if PA takes 70 days to cool off, as it did before, that takes us to end of March, Which has confluence with other charts about when PA maybe making another Move.
I will stress that this is pure speculation and has no real proof..It is an idea.......but one worth watching I feel

Nothing to be taken as Financial advice.
I will always say
"Only invest what you can afford to loose. When you are ready, take out your original investment. This way, it is only your profit that is at risk"
THAT is Financial advice
I will always say
"Only invest what you can afford to loose. When you are ready, take out your original investment. This way, it is only your profit that is at risk"
THAT is Financial advice
Clause de non-responsabilité
Les informations et publications ne sont pas destinées à être, et ne constituent pas, des conseils ou recommandations financiers, d'investissement, de trading ou autres fournis ou approuvés par TradingView. Pour en savoir plus, consultez les Conditions d'utilisation.
Nothing to be taken as Financial advice.
I will always say
"Only invest what you can afford to loose. When you are ready, take out your original investment. This way, it is only your profit that is at risk"
THAT is Financial advice
I will always say
"Only invest what you can afford to loose. When you are ready, take out your original investment. This way, it is only your profit that is at risk"
THAT is Financial advice
Clause de non-responsabilité
Les informations et publications ne sont pas destinées à être, et ne constituent pas, des conseils ou recommandations financiers, d'investissement, de trading ou autres fournis ou approuvés par TradingView. Pour en savoir plus, consultez les Conditions d'utilisation.