
Market View
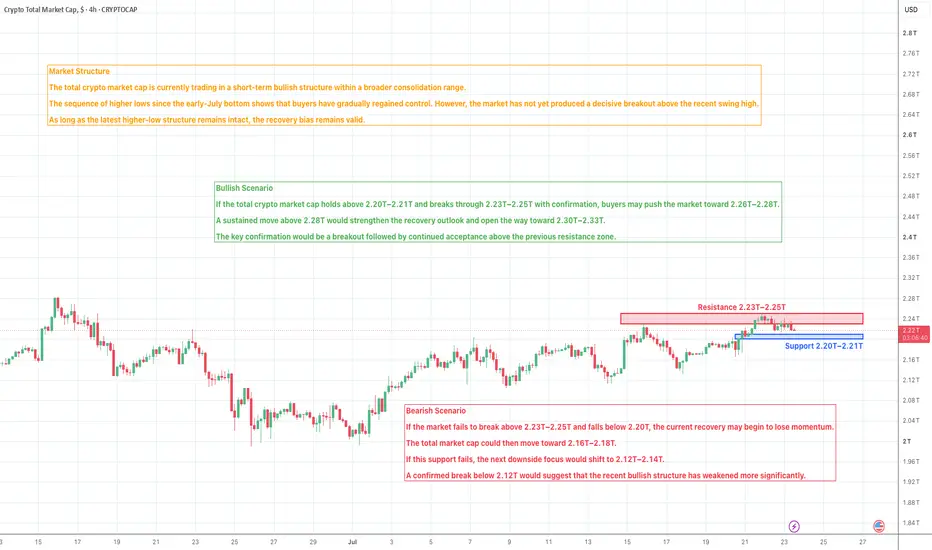
The total cryptocurrency market capitalization remains in a short-term bullish recovery structure on the 4H chart.
After finding support near the 2.00T area at the beginning of July, the market gradually formed higher lows and pushed back above 2.20T. The latest advance reached the 2.24T–2.26T region before momentum slowed and price moved into a shallow consolidation.
The broader recovery remains intact, but the market is now approaching an important resistance area. A confirmed breakout would strengthen the bullish outlook, while a loss of nearby support could lead to a deeper pullback before the next directional move.
Key Resistance Zone
First resistance: 2.23T–2.25T
This is the nearest resistance area and the zone currently limiting the latest advance.
A confirmed breakout above this region would indicate that buying momentum is strengthening again.
Second resistance: 2.26T–2.28T
This area includes the recent swing high and remains the main breakout zone on the current chart.
A sustained move above it would improve the broader recovery structure.
Major resistance: 2.30T–2.33T
This is the next major structural resistance area above the current range.
A confirmed move into this region would suggest that the crypto market is entering a stronger expansion phase.
Key Support Zone
First support: 2.20T–2.21T
This is the nearest short-term support and the first area buyers need to defend.
Holding above this zone would keep the current consolidation structure intact.
Second support: 2.16T–2.18T
This area has produced several recent buying reactions and remains an important structural support.
A break below it would weaken short-term bullish momentum.
Major support: 2.12T–2.14T
This is the deeper support zone formed during the previous recovery phase.
Losing this area would place the broader rebound structure under greater pressure.
Market Sentiment
Market sentiment remains cautiously bullish.
The sequence of higher lows continues to support the recovery, but hesitation near the recent highs shows that buyers still need a confirmed breakout.
Above 2.25T, bullish momentum may strengthen.
Below 2.20T, corrective pressure may increase.
Please share your view below:
Will the total crypto market cap break above 2.25T and continue toward 2.30T? Or will sellers defend resistance and push the market back toward 2.16T?
More market structure and key level updates will be shared regularly.
The total cryptocurrency market capitalization remains in a short-term bullish recovery structure on the 4H chart.
After finding support near the 2.00T area at the beginning of July, the market gradually formed higher lows and pushed back above 2.20T. The latest advance reached the 2.24T–2.26T region before momentum slowed and price moved into a shallow consolidation.
The broader recovery remains intact, but the market is now approaching an important resistance area. A confirmed breakout would strengthen the bullish outlook, while a loss of nearby support could lead to a deeper pullback before the next directional move.
Key Resistance Zone
First resistance: 2.23T–2.25T
This is the nearest resistance area and the zone currently limiting the latest advance.
A confirmed breakout above this region would indicate that buying momentum is strengthening again.
Second resistance: 2.26T–2.28T
This area includes the recent swing high and remains the main breakout zone on the current chart.
A sustained move above it would improve the broader recovery structure.
Major resistance: 2.30T–2.33T
This is the next major structural resistance area above the current range.
A confirmed move into this region would suggest that the crypto market is entering a stronger expansion phase.
Key Support Zone
First support: 2.20T–2.21T
This is the nearest short-term support and the first area buyers need to defend.
Holding above this zone would keep the current consolidation structure intact.
Second support: 2.16T–2.18T
This area has produced several recent buying reactions and remains an important structural support.
A break below it would weaken short-term bullish momentum.
Major support: 2.12T–2.14T
This is the deeper support zone formed during the previous recovery phase.
Losing this area would place the broader rebound structure under greater pressure.
Market Sentiment
Market sentiment remains cautiously bullish.
The sequence of higher lows continues to support the recovery, but hesitation near the recent highs shows that buyers still need a confirmed breakout.
Above 2.25T, bullish momentum may strengthen.
Below 2.20T, corrective pressure may increase.
Please share your view below:
Will the total crypto market cap break above 2.25T and continue toward 2.30T? Or will sellers defend resistance and push the market back toward 2.16T?
More market structure and key level updates will be shared regularly.

Publications connexes
Clause de non-responsabilité
Les informations et publications ne sont pas destinées à être, et ne constituent pas, des conseils ou recommandations financiers, d'investissement, de trading ou autres fournis ou approuvés par TradingView. Pour en savoir plus, consultez les Conditions d'utilisation.
Publications connexes
Clause de non-responsabilité
Les informations et publications ne sont pas destinées à être, et ne constituent pas, des conseils ou recommandations financiers, d'investissement, de trading ou autres fournis ou approuvés par TradingView. Pour en savoir plus, consultez les Conditions d'utilisation.