
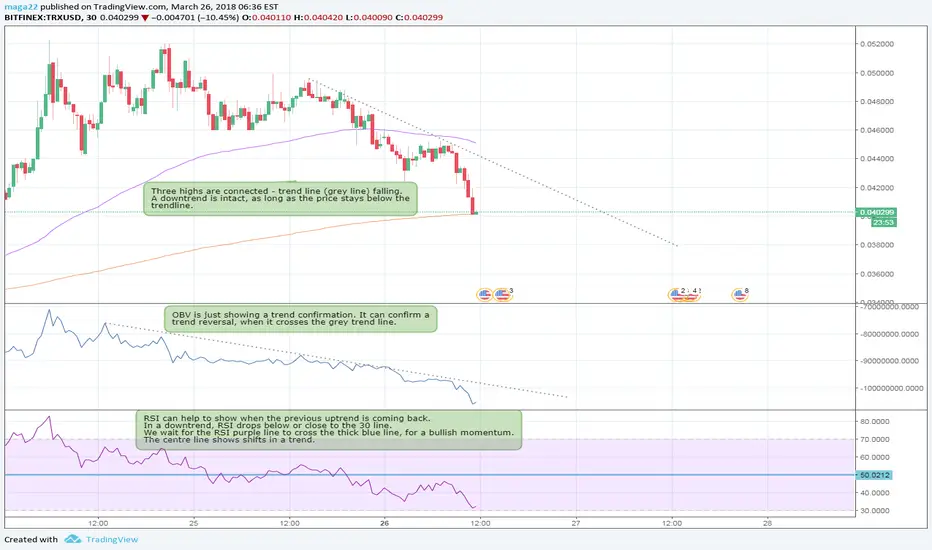
Everything confirms and shows a downtrend, but looking at the trendlines and centre line for the RSI indicator. It seems that we can perhaps hope for a reversal soon
IF
1.Candle stick crosses the grey dotted line and we see higher highs.
2.OBV line crosses grey dotted line and we see an increase
3.RSI crosses centre line (50) for a bullish momentum.
Do you agree with me? If not, please let me know how you would analyse it.
Thanks!
IF
1.Candle stick crosses the grey dotted line and we see higher highs.
2.OBV line crosses grey dotted line and we see an increase
3.RSI crosses centre line (50) for a bullish momentum.
Do you agree with me? If not, please let me know how you would analyse it.
Thanks!

Clause de non-responsabilité
Les informations et publications ne sont pas destinées à être, et ne constituent pas, des conseils ou recommandations financiers, d'investissement, de trading ou autres fournis ou approuvés par TradingView. Pour en savoir plus, consultez les Conditions d'utilisation.
Clause de non-responsabilité
Les informations et publications ne sont pas destinées à être, et ne constituent pas, des conseils ou recommandations financiers, d'investissement, de trading ou autres fournis ou approuvés par TradingView. Pour en savoir plus, consultez les Conditions d'utilisation.