
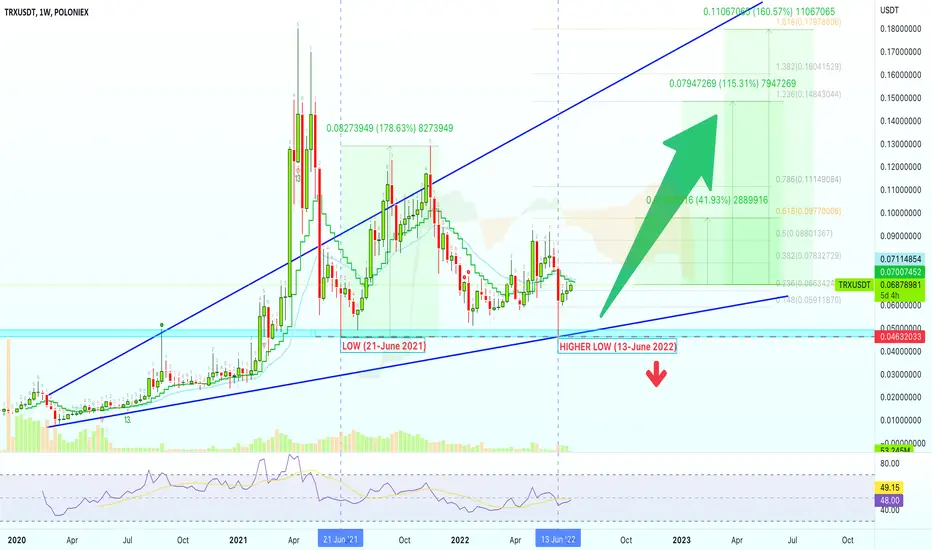
We have here the long-term chart for Tron (TRXUSDT).
We will focus on the higher low.
Look back to June 2021;
The marked support level was hit followed by a 175%+ bullish wave.
June 2022 we hit a higher low:
A new bullish wave can follow of similar magnitude.
We mapped for you multiple targets on the chart.
I hope you find this information useful.
Feel free to follow, share, comment & like if you enjoy the content.
Namaste.
We will focus on the higher low.
Look back to June 2021;
The marked support level was hit followed by a 175%+ bullish wave.
June 2022 we hit a higher low:
A new bullish wave can follow of similar magnitude.
We mapped for you multiple targets on the chart.
I hope you find this information useful.
Feel free to follow, share, comment & like if you enjoy the content.
Namaste.

🔥 Get the FULL (4-in-1) PREMIUM PACKAGE 👇
t.me/lamatrades/4 (Since 2017)
✅ FREE PREMIUM trade-numbers (4-10X) 👇
t.me/masteranandatrades/9043
🚨 TOP Results May 2026 👇
t.me/masteranandatrades/8778
t.me/lamatrades/4 (Since 2017)
✅ FREE PREMIUM trade-numbers (4-10X) 👇
t.me/masteranandatrades/9043
🚨 TOP Results May 2026 👇
t.me/masteranandatrades/8778
Publications connexes
Clause de non-responsabilité
Les informations et publications ne sont pas destinées à être, et ne constituent pas, des conseils ou recommandations financiers, d'investissement, de trading ou autres fournis ou approuvés par TradingView. Pour en savoir plus, consultez les Conditions d'utilisation.
🔥 Get the FULL (4-in-1) PREMIUM PACKAGE 👇
t.me/lamatrades/4 (Since 2017)
✅ FREE PREMIUM trade-numbers (4-10X) 👇
t.me/masteranandatrades/9043
🚨 TOP Results May 2026 👇
t.me/masteranandatrades/8778
t.me/lamatrades/4 (Since 2017)
✅ FREE PREMIUM trade-numbers (4-10X) 👇
t.me/masteranandatrades/9043
🚨 TOP Results May 2026 👇
t.me/masteranandatrades/8778
Publications connexes
Clause de non-responsabilité
Les informations et publications ne sont pas destinées à être, et ne constituent pas, des conseils ou recommandations financiers, d'investissement, de trading ou autres fournis ou approuvés par TradingView. Pour en savoir plus, consultez les Conditions d'utilisation.