
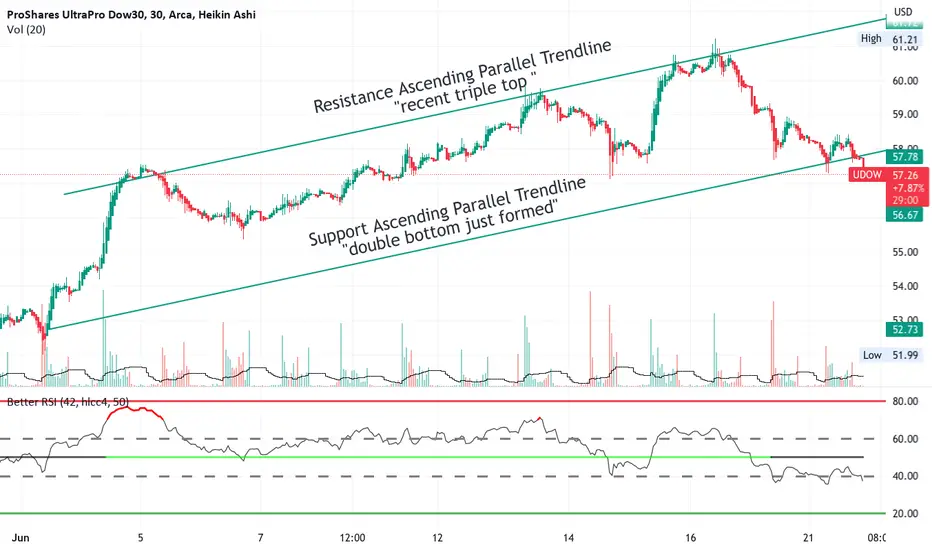
UDOW is shown here on the 30-minute chart rising over the past month in an ascending
parallel channel. The chart shows the price currently situated near to the bottom of
the channel which is the support trendline drawn onto the chart with the resistance
trendline as well. My trading plan is I will take a long trade of 50 shares with a stop loss
immediately below the support trendline. I see a targets as $ 62 and $ 65 making for
a very favorable reward for the risk taken. For the entry, I will use the 5- minute chart
and enter when the HA candles are green and the RSI is above 50. I realize that the DOW
has less volatility than the S & P or NASDAQ but with that is less overall risk of reversals
and pullbacks. I tend to take higher-risk trades but see this as having a balancing effect
in my overall portfolio.
parallel channel. The chart shows the price currently situated near to the bottom of
the channel which is the support trendline drawn onto the chart with the resistance
trendline as well. My trading plan is I will take a long trade of 50 shares with a stop loss
immediately below the support trendline. I see a targets as $ 62 and $ 65 making for
a very favorable reward for the risk taken. For the entry, I will use the 5- minute chart
and enter when the HA candles are green and the RSI is above 50. I realize that the DOW
has less volatility than the S & P or NASDAQ but with that is less overall risk of reversals
and pullbacks. I tend to take higher-risk trades but see this as having a balancing effect
in my overall portfolio.

Clause de non-responsabilité
Les informations et publications ne sont pas destinées à être, et ne constituent pas, des conseils ou recommandations financiers, d'investissement, de trading ou autres fournis ou approuvés par TradingView. Pour en savoir plus, consultez les Conditions d'utilisation.
Clause de non-responsabilité
Les informations et publications ne sont pas destinées à être, et ne constituent pas, des conseils ou recommandations financiers, d'investissement, de trading ou autres fournis ou approuvés par TradingView. Pour en savoir plus, consultez les Conditions d'utilisation.