
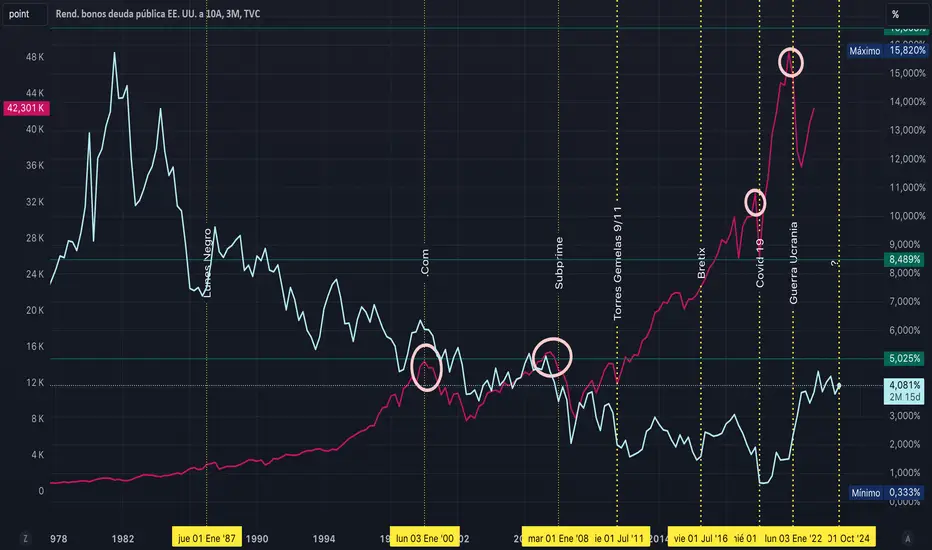
El icono de la inversión Warren Buffet tiene sus propios indicadores, en la gráfica esta uno de ellos mostrando el comportamiento con el bono americano a 10 años.
Hay algo que me llama la atención que esta encerrado en circulo, antes de que la recesión ecónomica empezara vendió posiciones para obtener mas liquidez para una recomprar mas adelante.
Actualmente la gráfica muestra comportamiento similares de años anteriores.
Nos estará diciendo algo o anticipando un movimiento que se viene ?
Hay algo que me llama la atención que esta encerrado en circulo, antes de que la recesión ecónomica empezara vendió posiciones para obtener mas liquidez para una recomprar mas adelante.
Actualmente la gráfica muestra comportamiento similares de años anteriores.
Nos estará diciendo algo o anticipando un movimiento que se viene ?
Transaction en cours
La pregunta que plantee ya fue resuelta, #Warren Buffet esta vendiendo posiciones para obtener mayor liquidez ahora tiene un record en liquidez para hacer mejores negocios a precios de remate en el futuro..El conocimiento es la clave.
Mantener un constante monitoreo para tomas las mejores desiciones y rentabilizarlas.
Note
The investment icon Warren Buffett has his own indicators, and on the chart, one of them shows the behavior with the 10-year US Treasury bond.Something catches my attention, which is circled. Before the economic recession started, he sold positions to obtain more liquidity for a later repurchase.
Currently, the chart shows similar behavior to previous years.
Is he telling us something or anticipating an upcoming move? The question I posed has already been answered, #WarrenBuffett is selling positions to obtain greater liquidity; he now has a record in liquidity to make better deals at bargain prices in the future.
Knowledge is the key.
Maintain constant monitoring to make the best decisions and make them profitable.

Clause de non-responsabilité
Les informations et publications ne sont pas destinées à être, et ne constituent pas, des conseils ou recommandations financiers, d'investissement, de trading ou autres fournis ou approuvés par TradingView. Pour en savoir plus, consultez les Conditions d'utilisation.
Clause de non-responsabilité
Les informations et publications ne sont pas destinées à être, et ne constituent pas, des conseils ou recommandations financiers, d'investissement, de trading ou autres fournis ou approuvés par TradingView. Pour en savoir plus, consultez les Conditions d'utilisation.