
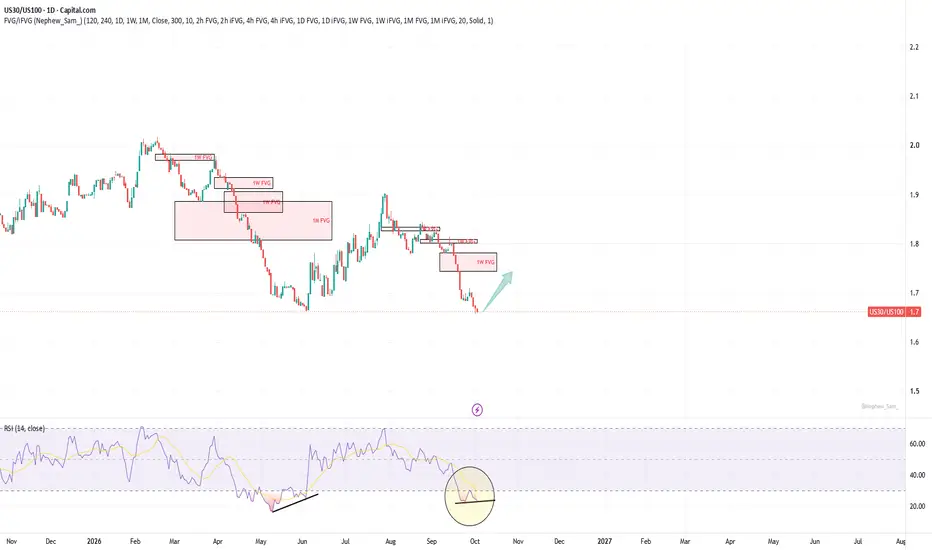
The daily positive divergence is not just on DJI and US30 charts but also on US30/US100 and DJI/NDX charts. This means if it will be confirmed Dow Jones may outperform nasdaq for some time.
Note
There is also a developing weekly divergence on US30 divided by US100 chart. When Nasdaq underperforms Dow Jones indices usually decline. We might see a deep correction on all indices soon.Ordre annulé
Daily divergence was invalidated today. Need to wait for a new one.Note
Well, it worked anyway. Looks like RSI length = 7 works better for this chart.
Clause de non-responsabilité
Les informations et publications ne sont pas destinées à être, et ne constituent pas, des conseils ou recommandations financiers, d'investissement, de trading ou autres fournis ou approuvés par TradingView. Pour en savoir plus, consultez les Conditions d'utilisation.
Clause de non-responsabilité
Les informations et publications ne sont pas destinées à être, et ne constituent pas, des conseils ou recommandations financiers, d'investissement, de trading ou autres fournis ou approuvés par TradingView. Pour en savoir plus, consultez les Conditions d'utilisation.