
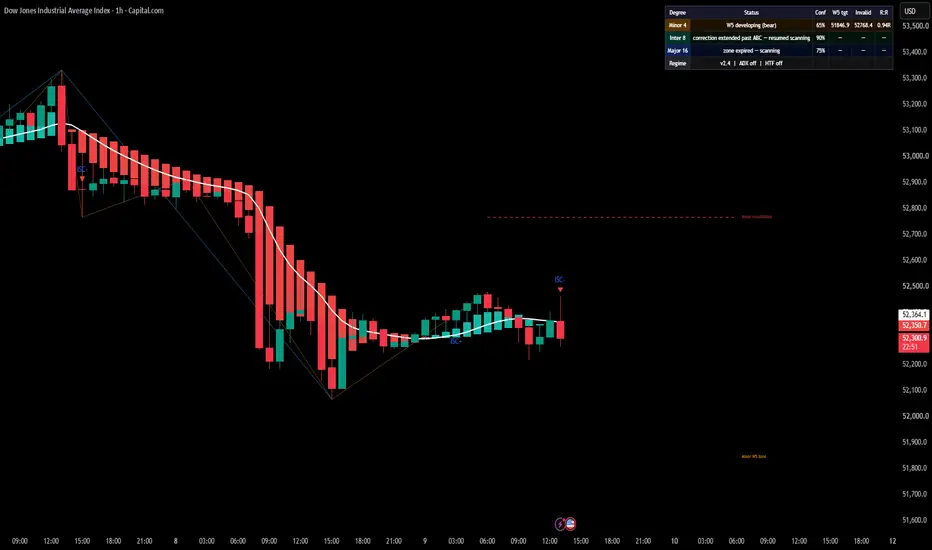
The Elliott Wave indicator is currently showcasing a bearish structure on US30, with price trading below the key invalidation zone highlighted on the chart.
The candle state has also shifted bearish, confirming a weaker short-term structure and increasing the probability of continuation to the downside.
As long as price remains below the highlighted invalidation level, the bearish count remains active, and a new bearish leg could develop from here.
A break back above invalidation would weaken the current bearish scenario and force a reassessment of the wave structure.
Current bias: Bearish while below invalidation.
Scenario: Potential continuation into a new downside leg.
Invalidation: Highlighted level above price.
The candle state has also shifted bearish, confirming a weaker short-term structure and increasing the probability of continuation to the downside.
As long as price remains below the highlighted invalidation level, the bearish count remains active, and a new bearish leg could develop from here.
A break back above invalidation would weaken the current bearish scenario and force a reassessment of the wave structure.
Current bias: Bearish while below invalidation.
Scenario: Potential continuation into a new downside leg.
Invalidation: Highlighted level above price.

Clause de non-responsabilité
Les informations et publications ne sont pas destinées à être, et ne constituent pas, des conseils ou recommandations financiers, d'investissement, de trading ou autres fournis ou approuvés par TradingView. Pour en savoir plus, consultez les Conditions d'utilisation.
Clause de non-responsabilité
Les informations et publications ne sont pas destinées à être, et ne constituent pas, des conseils ou recommandations financiers, d'investissement, de trading ou autres fournis ou approuvés par TradingView. Pour en savoir plus, consultez les Conditions d'utilisation.